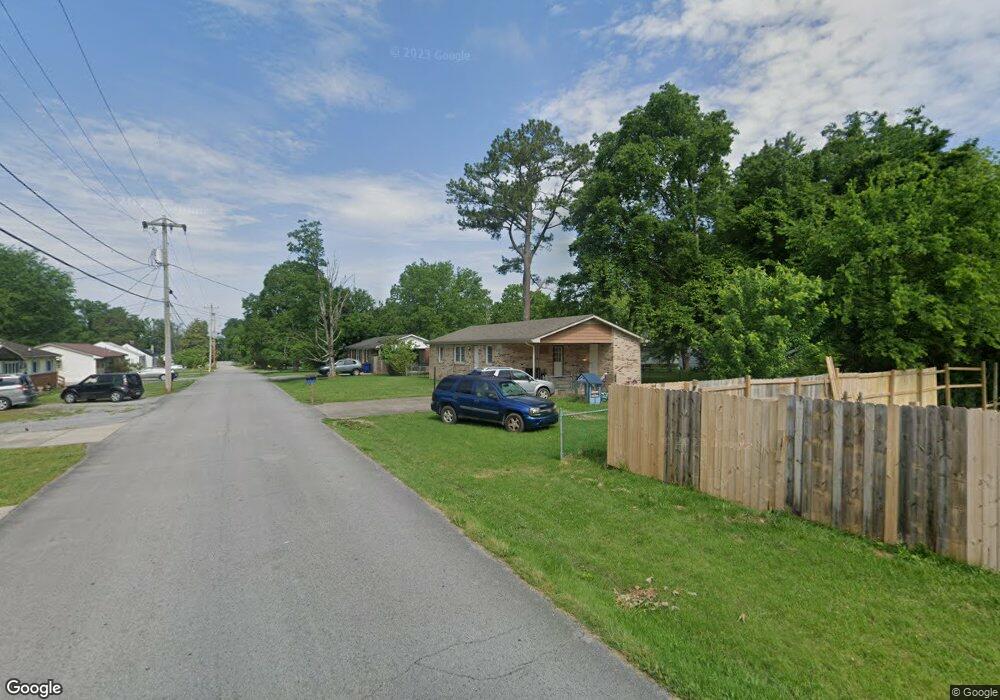
100 Kayden St Shelbyville, TN 37160
Estimated Value: $186,654 - $266,000
--
Bed
2
Baths
1,025
Sq Ft
$214/Sq Ft
Est. Value
About This Home
This home is located at 100 Kayden St, Shelbyville, TN 37160 and is currently estimated at $219,414, approximately $214 per square foot. 100 Kayden St is a home located in Bedford County with nearby schools including South Side Elementary School, Harris Middle School, and Shelbyville Central High School.
Ownership History
Date
Name
Owned For
Owner Type
Purchase Details
Closed on
Jul 25, 2014
Sold by
Luna Yolanda Cruces
Bought by
Green Timothy R
Current Estimated Value
Purchase Details
Closed on
Jul 1, 2005
Sold by
Puckett Teresa Berry
Bought by
Green Timothy R
Home Financials for this Owner
Home Financials are based on the most recent Mortgage that was taken out on this home.
Original Mortgage
$73,050
Interest Rate
5.54%
Purchase Details
Closed on
Jun 14, 2005
Sold by
Berry Raymond A
Bought by
Berry Teresa
Home Financials for this Owner
Home Financials are based on the most recent Mortgage that was taken out on this home.
Original Mortgage
$73,050
Interest Rate
5.54%
Purchase Details
Closed on
Feb 1, 1988
Bought by
Berry Teresa
Purchase Details
Closed on
Sep 9, 1987
Bought by
Berry Raymond A
Purchase Details
Closed on
Sep 9, 1981
Bought by
Crosslin Bryan A
Create a Home Valuation Report for This Property
The Home Valuation Report is an in-depth analysis detailing your home's value as well as a comparison with similar homes in the area
Home Values in the Area
Average Home Value in this Area
Purchase History
| Date | Buyer | Sale Price | Title Company |
|---|---|---|---|
| Green Timothy R | -- | -- | |
| Green Timothy R | $72,000 | -- | |
| Berry Teresa | -- | -- | |
| Berry Teresa | -- | -- | |
| Berry Raymond A | $44,000 | -- | |
| Crosslin Bryan A | -- | -- |
Source: Public Records
Mortgage History
| Date | Status | Borrower | Loan Amount |
|---|---|---|---|
| Previous Owner | Crosslin Bryan A | $73,050 |
Source: Public Records
Tax History Compared to Growth
Tax History
| Year | Tax Paid | Tax Assessment Tax Assessment Total Assessment is a certain percentage of the fair market value that is determined by local assessors to be the total taxable value of land and additions on the property. | Land | Improvement |
|---|---|---|---|---|
| 2025 | -- | $27,900 | $0 | $0 |
| 2024 | -- | $27,900 | $4,200 | $23,700 |
| 2023 | $1,062 | $27,900 | $4,200 | $23,700 |
| 2022 | $1,093 | $27,900 | $4,200 | $23,700 |
| 2021 | $992 | $27,900 | $4,200 | $23,700 |
| 2020 | $804 | $27,900 | $4,200 | $23,700 |
| 2019 | $804 | $18,150 | $3,250 | $14,900 |
| 2018 | $786 | $18,150 | $3,250 | $14,900 |
| 2017 | $786 | $18,150 | $3,250 | $14,900 |
| 2016 | $779 | $18,150 | $3,250 | $14,900 |
| 2015 | $779 | $18,150 | $3,250 | $14,900 |
| 2014 | $729 | $18,587 | $0 | $0 |
Source: Public Records
Map
Nearby Homes