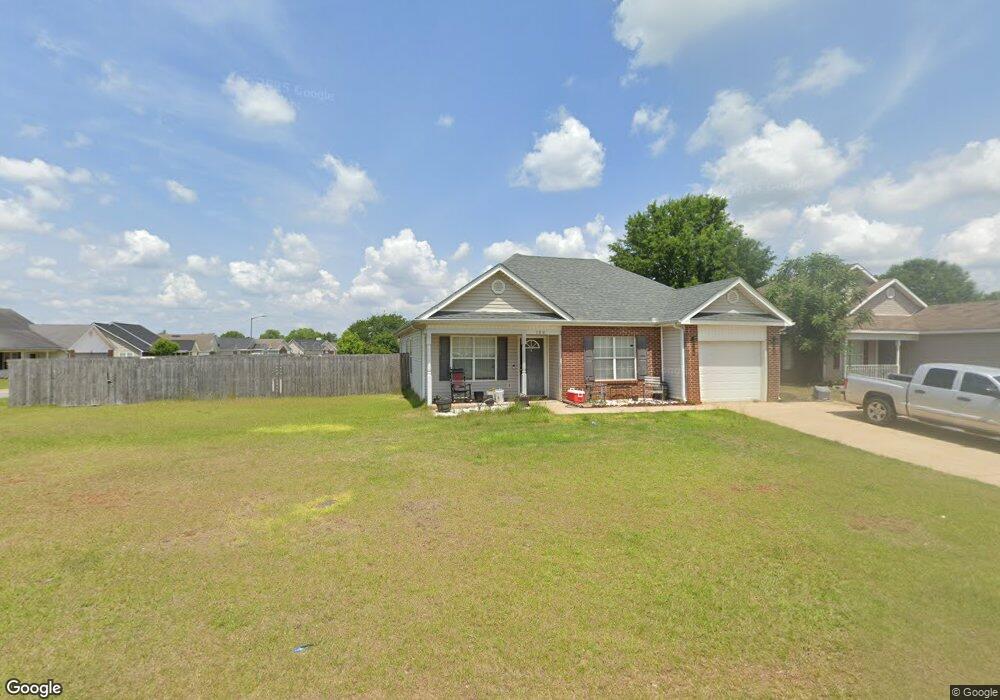
100 Langdon Ct Bonaire, GA 31005
Estimated Value: $201,319 - $209,000
3
Beds
2
Baths
1,344
Sq Ft
$153/Sq Ft
Est. Value
About This Home
This home is located at 100 Langdon Ct, Bonaire, GA 31005 and is currently estimated at $205,080, approximately $152 per square foot. 100 Langdon Ct is a home located in Houston County with nearby schools including David A. Perdue Primary School, David A. Perdue Elementary School, and Huntington Middle School.
Ownership History
Date
Name
Owned For
Owner Type
Purchase Details
Closed on
Jun 29, 2016
Sold by
Jennifer M
Bought by
Anderson Andy J
Current Estimated Value
Home Financials for this Owner
Home Financials are based on the most recent Mortgage that was taken out on this home.
Original Mortgage
$93,100
Outstanding Balance
$74,513
Interest Rate
3.66%
Mortgage Type
New Conventional
Estimated Equity
$130,567
Purchase Details
Closed on
Oct 19, 2009
Sold by
Pettaway Victesha R
Bought by
Andersen Jennifer M and Andersen Andy J
Home Financials for this Owner
Home Financials are based on the most recent Mortgage that was taken out on this home.
Original Mortgage
$104,080
Interest Rate
5.03%
Mortgage Type
FHA
Purchase Details
Closed on
Nov 21, 2003
Sold by
Bobby Pritchett Builder Inc
Bought by
Pettaway Victesha R
Purchase Details
Closed on
Feb 5, 2003
Sold by
Peach Blossom Developers Llc
Bought by
Bobby Pritchett Builder Inc
Create a Home Valuation Report for This Property
The Home Valuation Report is an in-depth analysis detailing your home's value as well as a comparison with similar homes in the area
Home Values in the Area
Average Home Value in this Area
Purchase History
| Date | Buyer | Sale Price | Title Company |
|---|---|---|---|
| Anderson Andy J | $5,000 | -- | |
| Andersen Jennifer M | $106,000 | None Available | |
| Pettaway Victesha R | $93,900 | -- | |
| Bobby Pritchett Builder Inc | -- | -- |
Source: Public Records
Mortgage History
| Date | Status | Borrower | Loan Amount |
|---|---|---|---|
| Open | Anderson Andy J | $93,100 | |
| Previous Owner | Andersen Jennifer M | $104,080 |
Source: Public Records
Tax History Compared to Growth
Tax History
| Year | Tax Paid | Tax Assessment Tax Assessment Total Assessment is a certain percentage of the fair market value that is determined by local assessors to be the total taxable value of land and additions on the property. | Land | Improvement |
|---|---|---|---|---|
| 2024 | $2,198 | $67,160 | $8,000 | $59,160 |
| 2023 | $1,857 | $56,320 | $8,000 | $48,320 |
| 2022 | $1,186 | $51,600 | $8,000 | $43,600 |
| 2021 | $998 | $43,160 | $7,200 | $35,960 |
| 2020 | $913 | $39,320 | $7,200 | $32,120 |
| 2019 | $913 | $39,320 | $7,200 | $32,120 |
| 2018 | $907 | $39,040 | $7,200 | $31,840 |
| 2017 | $908 | $39,040 | $7,200 | $31,840 |
| 2016 | $909 | $39,040 | $7,200 | $31,840 |
| 2015 | -- | $39,040 | $7,200 | $31,840 |
| 2014 | $390 | $39,040 | $7,200 | $31,840 |
| 2013 | $390 | $39,040 | $7,200 | $31,840 |
Source: Public Records
Map
Nearby Homes
- 303 Gray Fox Crossing
- 121 Chadwyck Cir
- 304 Jubilee Cir
- 306 Thornwood Dr
- 102 Brookhaven Dr
- 109 Idlewood Ct
- 214 Meadows Ln
- 212 Meadows Ln
- 212 Meadows Ln Unit 225
- 106 Idlewood Ct
- 203 Lattice Bend
- 413 Cannon Point Dr
- 416 Cannon Point Dr
- 308 Peach Blossom Rd
- 109 Vinewood Ct
- 116 Elk Run
- 103 Sandy Valley Dr
- 103 Grindstaff Dr
- 401 Feagin Mill Rd
- 213 Buckskin Dr
- 102 Langdon Ct
- 402 Wynfield Ln
- 315 Wynfield Ln
- 404 Wynfield Ln
- 104 Langdon Ct
- 401 Wynfield Ln
- 103 Langdon Ct
- 101 Langdon Ct
- 105 Langdon Ct
- 107 Langdon Ct
- 406 Wynfield Ln
- 324 Wynfield Ln
- 109 Landgon Ct
- 313 Wynfield Ln
- 403 Wynfield Ln
- 106 Langdon Ct
- 109 Langdon Ct
- 322 Wynfield Ln
- 408 Wynfield Ln
- 405 Wynfield Ln