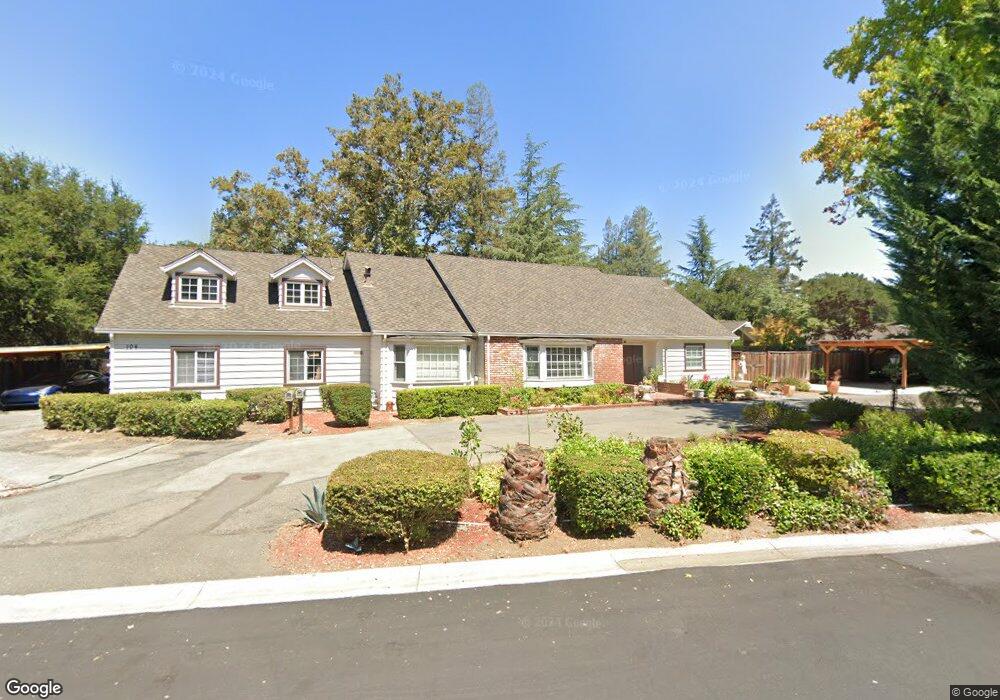
100 Montclair Rd Los Gatos, CA 95032
West Los Gatos NeighborhoodEstimated Value: $4,019,000 - $4,659,000
6
Beds
4
Baths
4,060
Sq Ft
$1,036/Sq Ft
Est. Value
About This Home
This home is located at 100 Montclair Rd, Los Gatos, CA 95032 and is currently estimated at $4,206,502, approximately $1,036 per square foot. 100 Montclair Rd is a home located in Santa Clara County with nearby schools including Westmont High School, Marshall Lane Elementary School, and Rolling Hills Middle.
Ownership History
Date
Name
Owned For
Owner Type
Purchase Details
Closed on
Jan 9, 2016
Sold by
Zadeh Fahimeh and Khoee Ali
Bought by
The Ali Khoee & Fahimeh Zadeh Revocable and Zadeh Fahimeh
Current Estimated Value
Purchase Details
Closed on
Dec 20, 2006
Sold by
Horowitz Katherine E
Bought by
Khoee Ali and Zadeh Fahimeh
Home Financials for this Owner
Home Financials are based on the most recent Mortgage that was taken out on this home.
Original Mortgage
$300,000
Interest Rate
6.11%
Mortgage Type
Stand Alone Second
Purchase Details
Closed on
May 10, 2002
Sold by
Horowitz Bruce G
Bought by
Horowitz Bruce G and Horowitz Katherine E
Home Financials for this Owner
Home Financials are based on the most recent Mortgage that was taken out on this home.
Original Mortgage
$500,000
Interest Rate
6.25%
Create a Home Valuation Report for This Property
The Home Valuation Report is an in-depth analysis detailing your home's value as well as a comparison with similar homes in the area
Home Values in the Area
Average Home Value in this Area
Purchase History
| Date | Buyer | Sale Price | Title Company |
|---|---|---|---|
| The Ali Khoee & Fahimeh Zadeh Revocable | -- | None Available | |
| Khoee Ali | $1,550,000 | First American Title Company | |
| Horowitz Bruce G | -- | Old Republic Title Company |
Source: Public Records
Mortgage History
| Date | Status | Borrower | Loan Amount |
|---|---|---|---|
| Closed | Khoee Ali | $300,000 | |
| Open | Khoee Ali | $1,085,000 | |
| Previous Owner | Horowitz Bruce G | $500,000 |
Source: Public Records
Tax History Compared to Growth
Tax History
| Year | Tax Paid | Tax Assessment Tax Assessment Total Assessment is a certain percentage of the fair market value that is determined by local assessors to be the total taxable value of land and additions on the property. | Land | Improvement |
|---|---|---|---|---|
| 2025 | $29,481 | $2,433,167 | $1,661,333 | $771,834 |
| 2024 | $29,481 | $2,385,458 | $1,628,758 | $756,700 |
| 2023 | $29,052 | $2,338,685 | $1,596,822 | $741,863 |
| 2022 | $28,754 | $2,292,829 | $1,565,512 | $727,317 |
| 2021 | $28,311 | $2,247,872 | $1,534,816 | $713,056 |
| 2020 | $27,744 | $2,224,824 | $1,519,079 | $705,745 |
| 2019 | $27,368 | $2,181,201 | $1,489,294 | $691,907 |
| 2018 | $26,732 | $2,138,434 | $1,460,093 | $678,341 |
| 2017 | $26,346 | $2,096,505 | $1,431,464 | $665,041 |
| 2016 | $24,753 | $2,055,398 | $1,403,397 | $652,001 |
| 2015 | $22,242 | $1,842,000 | $1,257,700 | $584,300 |
| 2014 | $20,958 | $1,753,640 | $1,200,000 | $553,640 |
Source: Public Records
Map
Nearby Homes
- 14324 Cordwood Ct
- 118 Via Lago
- 319 Montclair Rd
- 135 El Pinar
- 105 Rio Vista
- 15292 Stratford Ct
- 403 Montclair Rd
- 15393 Via Caballero
- 1697 Hyde Dr
- 1694 Hyde Dr
- 232 More Ave
- 142 Calle Larga
- 15495 Via Caballero
- 14001 Chester Ave
- 13741 Quito Rd
- 15360 Karl Ave
- 14225 Lora Dr Unit 90
- 14225 Lora Dr Unit 36
- 14225 Lora Dr Unit 70
- 15050 Oriole Rd
- 100 Montclair Rd
- 108 Montclair Rd
- 105 Montclair Rd
- 112 Montclair Rd
- 101 Montclair Rd
- 109 Montclair Rd
- 116 Montclair Rd
- 111 Montclair Ct
- 115 Montclair Ct
- 231 Plaza la Posada
- 14670 Quito Rd
- 229 Plaza la Posada
- 14691 Quito Rd
- 233 Plaza la Posada
- 14680 Quito Rd
- 119 Montclair Ct
- 14670 Quito Rd
- 227 Plaza la Posada
- 125 Montclair Rd
- 124 Montclair Rd