
Landlord's Agent in 2023
Mike DeStefano
Coldwell Banker Realty - Waltham
(781) 929-4921
2 in this area
123 Total Sales
Estimated Value: $1,058,000 - $1,143,000
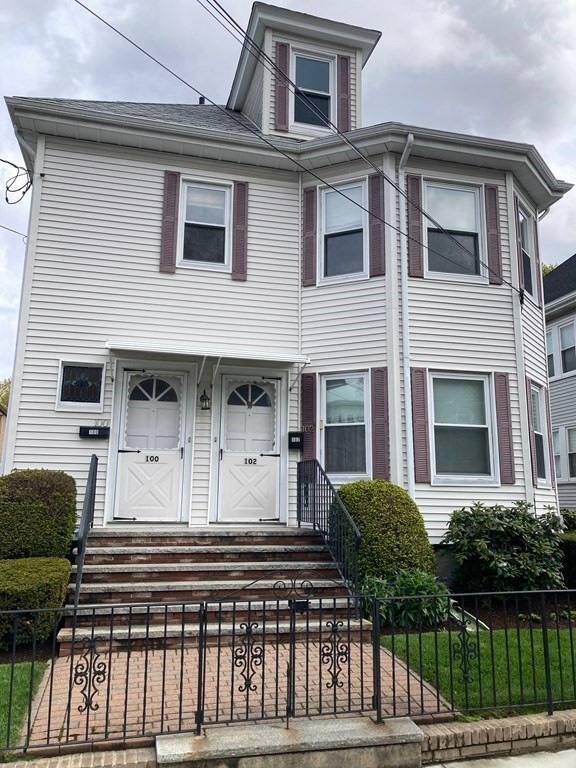
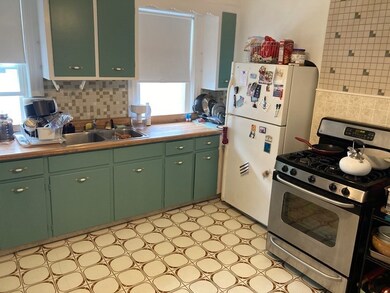
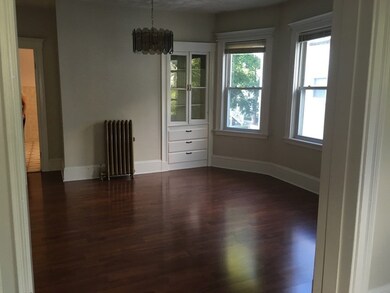
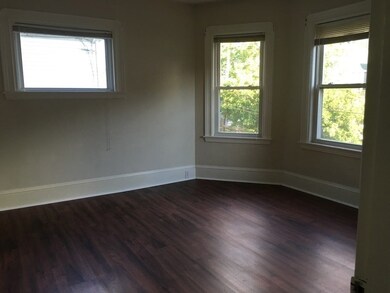
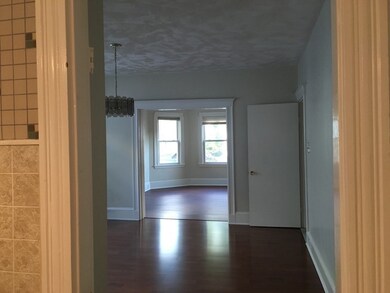
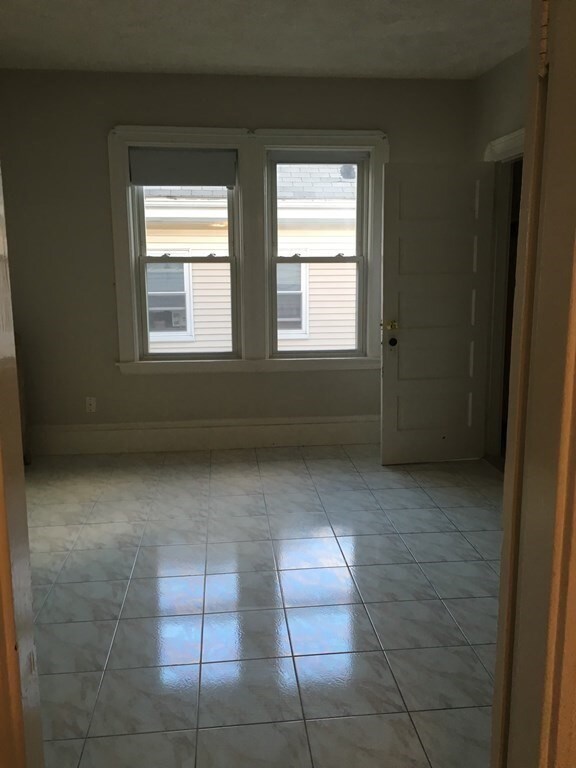
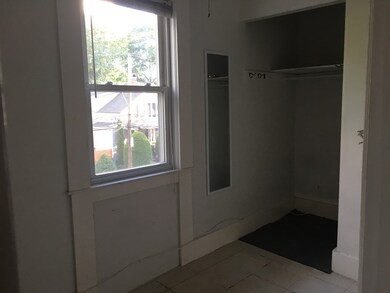
HIGHLY DESIRED SOUTH WALTHAM LOCALE!!!! All New Flooring throughout the unit. Freshly painted. LARGE Second floor unit offers Gas Heating, E-I-K with Gas Cooking, Dining Room with built in hutch, spacious living room.. Custom Tile in the Full Bath and Kitchen. Unit comes with one off street parking space with plenty of street parking as well. WASHER AND DRYER IN UNIT. NO ADDITIONAL STORAGE IN THE BASEMENT. Owner occupies the first level. NO PETS. Available fJUNE 15TH
Last Agent to Rent the Property
Coldwell Banker Realty - Waltham Listed on: 05/10/2023
| Date | Buyer | Sale Price | Title Company |
|---|---|---|---|
| Caci Teresa M | -- | None Available | |
| Caci Teresa M | -- | None Available | |
| Dimatteo Jason | -- | None Available | |
| Dimatteo Jason | -- | None Available | |
| Teresa M Caci Irt | -- | None Available | |
| Teresa M Caci Irt | -- | None Available | |
| Caci Irt | -- | -- | |
| Caci Irt | -- | -- | |
| Caci Angelo | -- | -- |
| Date | Event | Price | List to Sale | Price per Sq Ft |
|---|---|---|---|---|
| 05/12/2023 05/12/23 | Rented | $2,100 | 0.0% | -- |
| 05/10/2023 05/10/23 | Off Market | $2,100 | -- | -- |
| 05/05/2023 05/05/23 | For Rent | $2,100 | +35.5% | -- |
| 04/28/2016 04/28/16 | Rented | $1,550 | 0.0% | -- |
| 04/26/2016 04/26/16 | Under Contract | -- | -- | -- |
| 04/20/2016 04/20/16 | Price Changed | $1,550 | -3.1% | $2 / Sq Ft |
| 04/05/2016 04/05/16 | For Rent | $1,600 | -- | -- |
| Year | Tax Paid | Tax Assessment Tax Assessment Total Assessment is a certain percentage of the fair market value that is determined by local assessors to be the total taxable value of land and additions on the property. | Land | Improvement |
|---|---|---|---|---|
| 2025 | $8,308 | $846,000 | $352,900 | $493,100 |
| 2024 | $7,673 | $796,000 | $352,900 | $443,100 |
| 2023 | $7,727 | $748,700 | $321,400 | $427,300 |
| 2022 | $7,825 | $702,400 | $293,500 | $408,900 |
| 2021 | $7,416 | $655,100 | $265,500 | $389,600 |
| 2020 | $7,340 | $614,200 | $251,600 | $362,600 |
| 2019 | $6,879 | $543,400 | $249,000 | $294,400 |
| 2018 | $6,203 | $491,900 | $230,600 | $261,300 |
| 2017 | $5,915 | $470,900 | $209,600 | $261,300 |
| 2016 | $5,465 | $446,500 | $185,200 | $261,300 |
| 2015 | $5,211 | $396,900 | $181,700 | $215,200 |
Landlord's Agent in 2023
Mike DeStefano
Coldwell Banker Realty - Waltham
(781) 929-4921
2 in this area
123 Total Sales
Buyer's Agent in 2016
Colleen Kilfoil
A Cape House.Com
(774) 283-0546
98 Total Sales
Source: MLS Property Information Network (MLS PIN)
MLS Number: 73109487
APN: WALT-000069-000039-000021
Disclaimer: Certain information contained herein is derived from information provided by parties other than Homes.com. All information provided is deemed reliable, but is not guaranteed to be accurate and should be independently verified.
![]() The property listing data and information, or the Images, set forth herein were provided to MLS Property Information Network, Inc. from third party sources, including sellers, lessors and public records, and were compiled by MLS Property Information Network, Inc. The property listing data and information, and the Images, are for the personal, non-commercial use of consumers having a good faith interest in purchasing or leasing listed properties of the type displayed to them and may not be used for any purpose other than to identify prospective properties which such consumers may have a good faith interest in purchasing or leasing. MLS Property Information Network, Inc. and its subscribers disclaim any and all representations and warranties as to the accuracy of the property listing data and information, or as to the accuracy of any of the Images, set forth herein.
The property listing data and information, or the Images, set forth herein were provided to MLS Property Information Network, Inc. from third party sources, including sellers, lessors and public records, and were compiled by MLS Property Information Network, Inc. The property listing data and information, and the Images, are for the personal, non-commercial use of consumers having a good faith interest in purchasing or leasing listed properties of the type displayed to them and may not be used for any purpose other than to identify prospective properties which such consumers may have a good faith interest in purchasing or leasing. MLS Property Information Network, Inc. and its subscribers disclaim any and all representations and warranties as to the accuracy of the property listing data and information, or as to the accuracy of any of the Images, set forth herein.