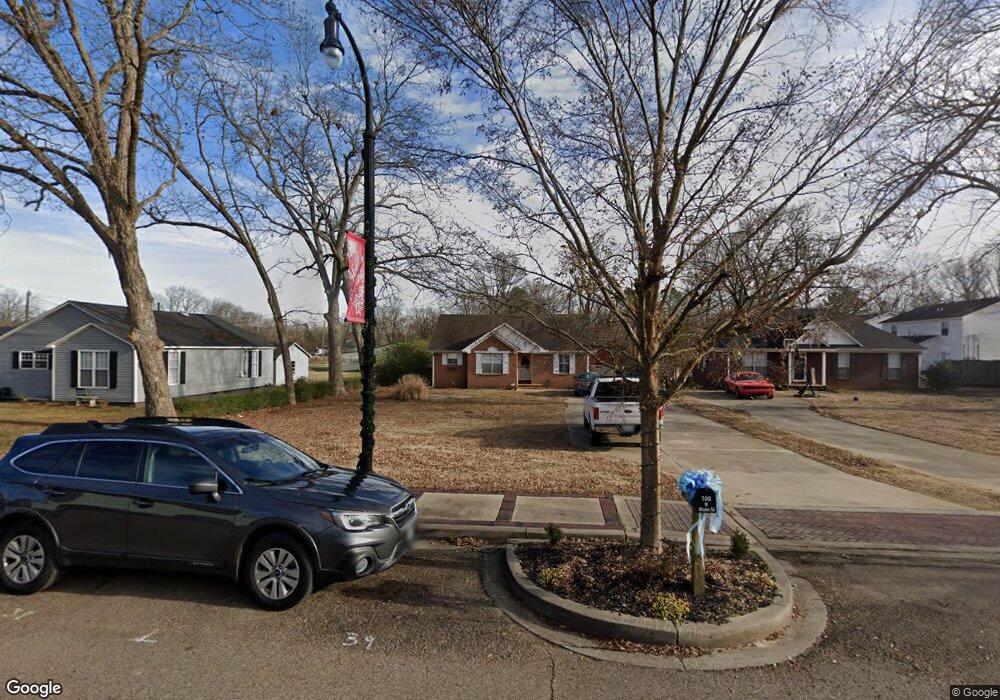
100 N Main St Brighton, TN 38011
Estimated Value: $187,000 - $248,000
3
Beds
2
Baths
1,223
Sq Ft
$182/Sq Ft
Est. Value
About This Home
This home is located at 100 N Main St, Brighton, TN 38011 and is currently estimated at $222,795, approximately $182 per square foot. 100 N Main St is a home located in Tipton County with nearby schools including Brighton Elementary School, Brighton Middle School, and Brighton High School.
Ownership History
Date
Name
Owned For
Owner Type
Purchase Details
Closed on
May 29, 2020
Sold by
Marvine Coley Vera and The Vera Marvine Coley Living
Bought by
Branson Yarbro
Current Estimated Value
Home Financials for this Owner
Home Financials are based on the most recent Mortgage that was taken out on this home.
Original Mortgage
$115,000
Outstanding Balance
$103,285
Interest Rate
3.3%
Mortgage Type
USDA
Estimated Equity
$119,510
Purchase Details
Closed on
Mar 22, 2017
Sold by
Yarbro Coley Vera Marvine
Bought by
Coley Vera Marvine Living Trust
Purchase Details
Closed on
Jul 25, 2006
Sold by
Baskin Timothy W
Bought by
Yarbro Vera M
Home Financials for this Owner
Home Financials are based on the most recent Mortgage that was taken out on this home.
Original Mortgage
$107,242
Interest Rate
6.74%
Purchase Details
Closed on
Sep 17, 2001
Sold by
Crownridge Builders Llc
Bought by
Tim Baskin
Purchase Details
Closed on
Aug 16, 2000
Bought by
Crownridge Builders Llc
Purchase Details
Closed on
Jan 26, 1998
Sold by
Mclister S C
Bought by
Baskin Timothy W
Create a Home Valuation Report for This Property
The Home Valuation Report is an in-depth analysis detailing your home's value as well as a comparison with similar homes in the area
Home Values in the Area
Average Home Value in this Area
Purchase History
| Date | Buyer | Sale Price | Title Company |
|---|---|---|---|
| Branson Yarbro | $115,000 | None Available | |
| Coley Vera Marvine Living Trust | -- | -- | |
| Yarbro Vera M | $105,000 | -- | |
| Tim Baskin | -- | -- | |
| Crownridge Builders Llc | $18,900 | -- | |
| Baskin Timothy W | $10,000 | -- |
Source: Public Records
Mortgage History
| Date | Status | Borrower | Loan Amount |
|---|---|---|---|
| Open | Branson Yarbro | $115,000 | |
| Previous Owner | Baskin Timothy W | $107,242 |
Source: Public Records
Tax History
| Year | Tax Paid | Tax Assessment Tax Assessment Total Assessment is a certain percentage of the fair market value that is determined by local assessors to be the total taxable value of land and additions on the property. | Land | Improvement |
|---|---|---|---|---|
| 2025 | -- | $40,325 | $4,325 | $36,000 |
| 2024 | $0 | $40,325 | $4,325 | $36,000 |
| 2023 | $910 | $40,325 | $4,325 | $36,000 |
| 2022 | $859 | $28,250 | $3,200 | $25,050 |
| 2021 | $859 | $28,250 | $3,200 | $25,050 |
| 2020 | $820 | $28,250 | $3,200 | $25,050 |
| 2019 | $827 | $24,175 | $3,200 | $20,975 |
| 2018 | $827 | $24,175 | $3,200 | $20,975 |
| 2017 | $827 | $24,175 | $3,200 | $20,975 |
| 2016 | $762 | $24,175 | $3,200 | $20,975 |
| 2015 | $761 | $23,850 | $3,200 | $20,650 |
| 2014 | $761 | $23,844 | $0 | $0 |
Source: Public Records
Map
Nearby Homes
- 148 Michelle Dr
- 0 Old Highway 51 S
- 841 Old Highway 51 S
- 0 Lucy Kelly Rd Unit 10207893
- 220 W Oaklawn Dr
- 4417 U S Highway 51
- 000 Mae Sigma Rd
- 0 Mae Sigma Rd
- 67 Oak Ave
- 464 Carrington Ave
- 01 Lucy Kelly
- 196 Bloomington Dr
- 215 Woodshire Ln
- 586 Wylie Dr
- 2610 Brighton Clopton Rd
- 0 Fayne Rd
- 0 Dunlap Orphanage Rd Unit 10175430
- 0 Dunlap Orphanage Rd Unit 21216554
- 2939 Brighton-Clopton Rd
- 806 Dogwood Ln
- 88 N Main St
- 116 N Main St
- 36 Villa Ln Unit 5B
- 50 Villa Ln Unit 7B
- 649 E Woodlawn Ave
- 101 N Main St
- 113 N Main St
- 12 Villa Ln
- 89 N Main St
- 13 Villa Ln
- 13 Villa Ln Unit 2B
- 71 N Main St
- 148 N Main St
- 57 N Main St
- 36 Preston Cir
- 30 N Main St
- 41 Preston Cir
- 914 E Kenwood Ave
- 183 N Main St
- 930 E Kenwood Ave
Your Personal Tour Guide
Ask me questions while you tour the home.