Estimated Value: $453,230 - $631,000
3
Beds
2
Baths
1,200
Sq Ft
$460/Sq Ft
Est. Value
About This Home
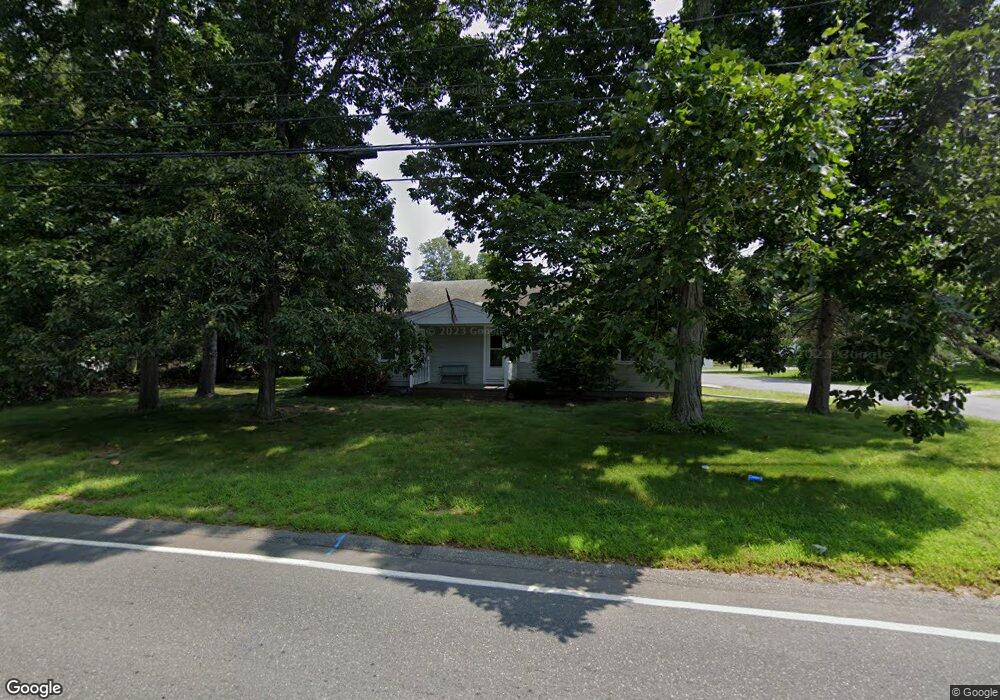
This home is located at 100 N Policy St, Salem, NH 03079 and is currently estimated at $551,808, approximately $459 per square foot. 100 N Policy St is a home located in Rockingham County with nearby schools including Mary A. Fisk Elementary School, Woodbury School, and Salem High School.
Ownership History
Date
Name
Owned For
Owner Type
Purchase Details
Closed on
Jan 17, 2008
Sold by
Option One Mtg Loan T
Bought by
D & M Demers Re Inv and Wells Fargo Bank Na
Current Estimated Value
Purchase Details
Closed on
Oct 29, 2007
Sold by
Grant Melissa M
Bought by
Wells Fargo Bank Na
Purchase Details
Closed on
Jun 2, 2005
Sold by
Bernier Bryan M
Bought by
Grant Melissa M
Home Financials for this Owner
Home Financials are based on the most recent Mortgage that was taken out on this home.
Original Mortgage
$277,600
Interest Rate
5.83%
Mortgage Type
Purchase Money Mortgage
Purchase Details
Closed on
Oct 16, 2002
Sold by
Toth John and Toth Linda
Bought by
Bernier Bryan M
Home Financials for this Owner
Home Financials are based on the most recent Mortgage that was taken out on this home.
Original Mortgage
$232,750
Interest Rate
6.18%
Mortgage Type
Purchase Money Mortgage
Create a Home Valuation Report for This Property
The Home Valuation Report is an in-depth analysis detailing your home's value as well as a comparison with similar homes in the area
Home Values in the Area
Average Home Value in this Area
Purchase History
| Date | Buyer | Sale Price | Title Company |
|---|---|---|---|
| D & M Demers Re Inv | $230,000 | -- | |
| Wells Fargo Bank Na | $298,200 | -- | |
| Grant Melissa M | $347,000 | -- | |
| Bernier Bryan M | $245,000 | -- |
Source: Public Records
Mortgage History
| Date | Status | Borrower | Loan Amount |
|---|---|---|---|
| Open | Bernier Bryan M | $172,500 | |
| Previous Owner | Grant Melissa M | $277,600 | |
| Previous Owner | Bernier Bryan M | $232,750 |
Source: Public Records
Tax History Compared to Growth
Tax History
| Year | Tax Paid | Tax Assessment Tax Assessment Total Assessment is a certain percentage of the fair market value that is determined by local assessors to be the total taxable value of land and additions on the property. | Land | Improvement |
|---|---|---|---|---|
| 2024 | $5,942 | $337,600 | $152,300 | $185,300 |
| 2023 | $5,726 | $337,600 | $152,300 | $185,300 |
| 2022 | $5,418 | $337,600 | $152,300 | $185,300 |
| 2021 | $5,395 | $337,600 | $152,300 | $185,300 |
| 2020 | $5,375 | $244,100 | $108,800 | $135,300 |
| 2019 | $5,365 | $244,100 | $108,800 | $135,300 |
| 2018 | $5,275 | $244,100 | $108,800 | $135,300 |
| 2017 | $5,087 | $244,100 | $108,800 | $135,300 |
| 2016 | $4,987 | $244,100 | $108,800 | $135,300 |
| 2015 | $4,663 | $218,000 | $111,900 | $106,100 |
| 2014 | $4,532 | $218,000 | $111,900 | $106,100 |
| 2013 | $4,460 | $218,000 | $111,900 | $106,100 |
Source: Public Records
Map
Nearby Homes