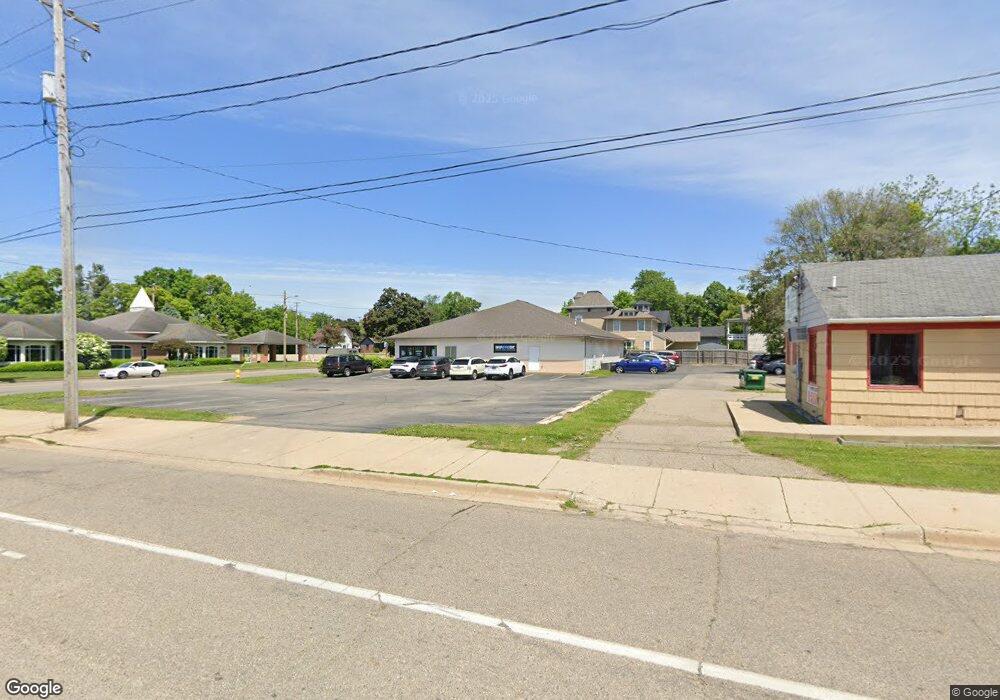
100 North Ave Battle Creek, MI 49017
Northeast Battle Creek NeighborhoodEstimated Value: $589,425
--
Bed
--
Bath
4,200
Sq Ft
$140/Sq Ft
Est. Value
About This Home
This home is located at 100 North Ave, Battle Creek, MI 49017 and is currently priced at $589,425, approximately $140 per square foot. 100 North Ave is a home located in Calhoun County with nearby schools including Northwestern Middle School, Battle Creek Central High School, and St. Philip Catholic Central High School.
Ownership History
Date
Name
Owned For
Owner Type
Purchase Details
Closed on
Jun 9, 2011
Sold by
Bbr & G Llc
Bought by
Fifth Third Bank
Current Estimated Value
Purchase Details
Closed on
Jul 22, 2004
Sold by
Singh Robert A and Singh Laura K
Bought by
100 North Avenue Llc
Purchase Details
Closed on
Oct 30, 2003
Sold by
Battle Creek Unlimited
Bought by
Singh Robert A
Purchase Details
Closed on
Oct 17, 2001
Bought by
Battle Creek Unlimited Inc
Purchase Details
Closed on
Oct 29, 1998
Bought by
Cereal City Development Corp
Create a Home Valuation Report for This Property
The Home Valuation Report is an in-depth analysis detailing your home's value as well as a comparison with similar homes in the area
Home Values in the Area
Average Home Value in this Area
Purchase History
| Date | Buyer | Sale Price | Title Company |
|---|---|---|---|
| Fifth Third Bank | $225,000 | None Available | |
| 100 North Avenue Llc | -- | -- | |
| Singh Robert A | $25,000 | -- | |
| Singh Robert A | $25,000 | -- | |
| Battle Creek Unlimited Inc | -- | -- | |
| Cereal City Development Corp | $40,000 | -- |
Source: Public Records
Tax History Compared to Growth
Tax History
| Year | Tax Paid | Tax Assessment Tax Assessment Total Assessment is a certain percentage of the fair market value that is determined by local assessors to be the total taxable value of land and additions on the property. | Land | Improvement |
|---|---|---|---|---|
| 2025 | -- | $152,300 | $0 | $0 |
| 2024 | $5,318 | $136,985 | $0 | $0 |
| 2023 | $6,766 | $125,372 | $0 | $0 |
| 2022 | $4,807 | $107,847 | $0 | $0 |
| 2021 | $6,429 | $105,291 | $0 | $0 |
| 2020 | $7,783 | $97,695 | $0 | $0 |
| 2019 | $8,174 | $99,673 | $0 | $0 |
| 2018 | $8,174 | $120,326 | $14,603 | $105,723 |
| 2017 | $9,073 | $187,454 | $0 | $0 |
| 2016 | $9,050 | $164,331 | $0 | $0 |
| 2015 | $8,869 | $159,439 | $0 | $0 |
| 2014 | $8,869 | $138,013 | $0 | $0 |
Source: Public Records
Map
Nearby Homes