Estimated Value: $918,676 - $1,422,000
3
Beds
2
Baths
1,992
Sq Ft
$586/Sq Ft
Est. Value
About This Home
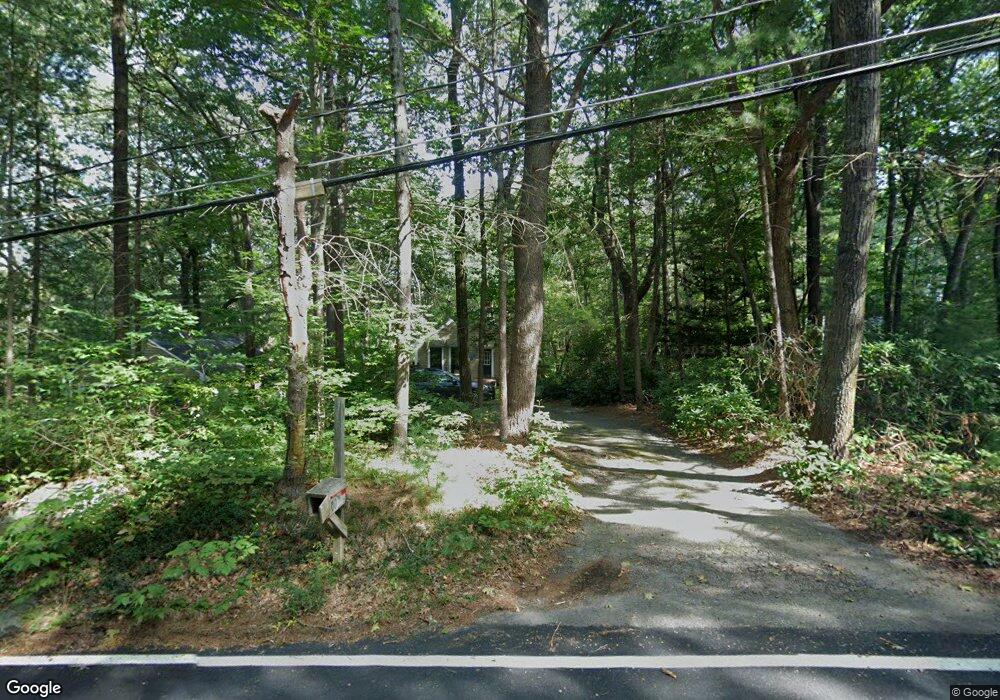
This home is located at 100 Pine St, Dover, MA 02030 and is currently estimated at $1,166,419, approximately $585 per square foot. 100 Pine St is a home located in Norfolk County with nearby schools including Chickering Elementary School, Dover-Sherborn Regional Middle School, and Dover-Sherborn Regional High School.
Ownership History
Date
Name
Owned For
Owner Type
Purchase Details
Closed on
Dec 11, 1998
Sold by
Beacham Harold R
Bought by
Sullivan Candice J and Sullivan James
Current Estimated Value
Home Financials for this Owner
Home Financials are based on the most recent Mortgage that was taken out on this home.
Original Mortgage
$310,000
Outstanding Balance
$70,538
Interest Rate
6.8%
Mortgage Type
Purchase Money Mortgage
Estimated Equity
$1,095,881
Purchase Details
Closed on
Jun 22, 1993
Sold by
Tankersley Velma B
Bought by
Beacham Harold R
Create a Home Valuation Report for This Property
The Home Valuation Report is an in-depth analysis detailing your home's value as well as a comparison with similar homes in the area
Home Values in the Area
Average Home Value in this Area
Purchase History
| Date | Buyer | Sale Price | Title Company |
|---|---|---|---|
| Sullivan Candice J | $355,000 | -- | |
| Beacham Harold R | $256,500 | -- |
Source: Public Records
Mortgage History
| Date | Status | Borrower | Loan Amount |
|---|---|---|---|
| Open | Beacham Harold R | $310,000 | |
| Previous Owner | Beacham Harold R | $173,000 | |
| Previous Owner | Beacham Harold R | $172,500 |
Source: Public Records
Tax History
| Year | Tax Paid | Tax Assessment Tax Assessment Total Assessment is a certain percentage of the fair market value that is determined by local assessors to be the total taxable value of land and additions on the property. | Land | Improvement |
|---|---|---|---|---|
| 2025 | $9,423 | $836,100 | $578,600 | $257,500 |
| 2024 | $8,524 | $777,700 | $539,400 | $238,300 |
| 2023 | $8,429 | $691,500 | $470,800 | $220,700 |
| 2022 | $7,694 | $619,500 | $431,500 | $188,000 |
| 2021 | $7,079 | $549,200 | $372,700 | $176,500 |
| 2020 | $7,052 | $549,200 | $372,700 | $176,500 |
| 2019 | $7,101 | $549,200 | $372,700 | $176,500 |
| 2018 | $6,918 | $538,800 | $372,700 | $166,100 |
| 2017 | $6,645 | $509,200 | $323,700 | $185,500 |
| 2016 | $6,332 | $491,600 | $313,800 | $177,800 |
| 2015 | $6,666 | $524,900 | $343,300 | $181,600 |
Source: Public Records
Map
Nearby Homes
Your Personal Tour Guide
Ask me questions while you tour the home.