Estimated Value: $136,000 - $185,000
2
Beds
1
Bath
880
Sq Ft
$184/Sq Ft
Est. Value
About This Home
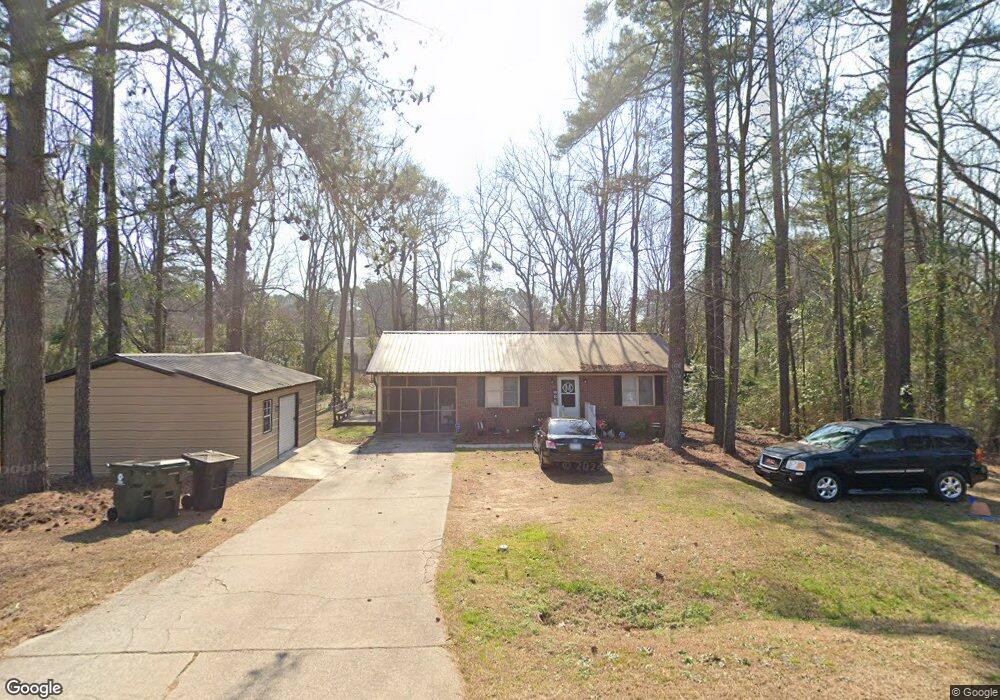
This home is located at 100 Price St, Erwin, NC 28339 and is currently estimated at $161,884, approximately $183 per square foot. 100 Price St is a home located in Harnett County with nearby schools including Erwin Elementary School, Coats-Erwin Middle School, and Triton High School.
Ownership History
Date
Name
Owned For
Owner Type
Purchase Details
Closed on
Jun 17, 2013
Sold by
Curr Well Developments Llc
Bought by
Mclean Shantyra L
Current Estimated Value
Home Financials for this Owner
Home Financials are based on the most recent Mortgage that was taken out on this home.
Original Mortgage
$60,204
Outstanding Balance
$42,902
Interest Rate
3.53%
Mortgage Type
New Conventional
Estimated Equity
$118,982
Purchase Details
Closed on
Dec 20, 2011
Sold by
Payne Leroy F
Bought by
Bank Of America
Create a Home Valuation Report for This Property
The Home Valuation Report is an in-depth analysis detailing your home's value as well as a comparison with similar homes in the area
Home Values in the Area
Average Home Value in this Area
Purchase History
| Date | Buyer | Sale Price | Title Company |
|---|---|---|---|
| Mclean Shantyra L | $59,000 | None Available | |
| Bank Of America | $40,500 | None Available |
Source: Public Records
Mortgage History
| Date | Status | Borrower | Loan Amount |
|---|---|---|---|
| Open | Mclean Shantyra L | $60,204 |
Source: Public Records
Tax History
| Year | Tax Paid | Tax Assessment Tax Assessment Total Assessment is a certain percentage of the fair market value that is determined by local assessors to be the total taxable value of land and additions on the property. | Land | Improvement |
|---|---|---|---|---|
| 2025 | $1,270 | $99,042 | $0 | $0 |
| 2024 | $1,240 | $99,042 | $0 | $0 |
| 2023 | $1,240 | $99,042 | $0 | $0 |
| 2022 | $1,077 | $99,042 | $0 | $0 |
| 2021 | $1,077 | $73,240 | $0 | $0 |
| 2020 | $1,077 | $73,240 | $0 | $0 |
| 2019 | $1,062 | $73,240 | $0 | $0 |
| 2018 | $1,055 | $73,240 | $0 | $0 |
| 2017 | $1,055 | $73,240 | $0 | $0 |
| 2016 | $1,055 | $73,490 | $0 | $0 |
| 2015 | -- | $73,490 | $0 | $0 |
| 2014 | -- | $73,490 | $0 | $0 |
Source: Public Records
Map
Nearby Homes