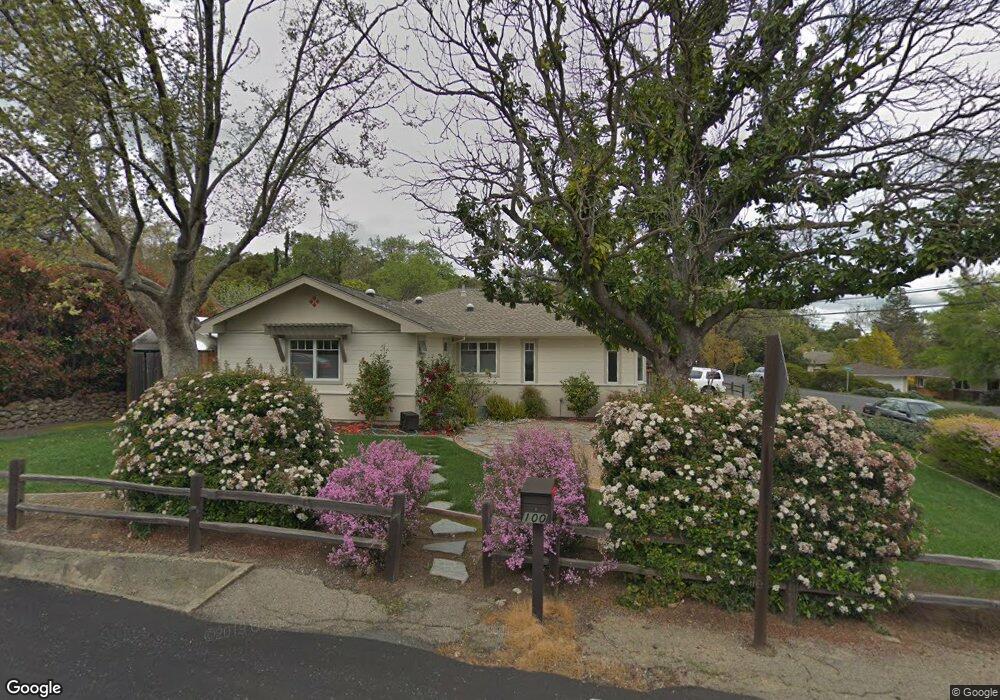
100 Random Way Pleasant Hill, CA 94523
Estimated Value: $1,047,000 - $1,288,000
3
Beds
1
Bath
1,258
Sq Ft
$918/Sq Ft
Est. Value
About This Home
This home is located at 100 Random Way, Pleasant Hill, CA 94523 and is currently estimated at $1,154,394, approximately $917 per square foot. 100 Random Way is a home located in Contra Costa County with nearby schools including Pleasant Hill Elementary School, Pleasant Hill Middle School, and College Park High School.
Ownership History
Date
Name
Owned For
Owner Type
Purchase Details
Closed on
Dec 10, 2004
Sold by
Speer James Alan and Speer Natalie Gavric
Bought by
Speer James Alan and Speer Natalie Gavric
Current Estimated Value
Purchase Details
Closed on
Jun 13, 2001
Sold by
Soeth Mark Albert and Soeth Tracey Ann
Bought by
Speer James A and Speer Natalie G
Home Financials for this Owner
Home Financials are based on the most recent Mortgage that was taken out on this home.
Original Mortgage
$329,600
Outstanding Balance
$125,643
Interest Rate
7.15%
Mortgage Type
Purchase Money Mortgage
Estimated Equity
$1,028,751
Purchase Details
Closed on
Dec 9, 1993
Sold by
Sumarriva Marco R
Bought by
Soeth Mark Albert and Soeth Tracey Ann
Home Financials for this Owner
Home Financials are based on the most recent Mortgage that was taken out on this home.
Original Mortgage
$203,150
Interest Rate
3.37%
Mortgage Type
Purchase Money Mortgage
Create a Home Valuation Report for This Property
The Home Valuation Report is an in-depth analysis detailing your home's value as well as a comparison with similar homes in the area
Home Values in the Area
Average Home Value in this Area
Purchase History
| Date | Buyer | Sale Price | Title Company |
|---|---|---|---|
| Speer James Alan | -- | -- | |
| Speer James A | $412,000 | Old Republic Title Company | |
| Soeth Mark Albert | $228,000 | Placer Title Company |
Source: Public Records
Mortgage History
| Date | Status | Borrower | Loan Amount |
|---|---|---|---|
| Open | Speer James A | $329,600 | |
| Previous Owner | Soeth Mark Albert | $203,150 |
Source: Public Records
Tax History
| Year | Tax Paid | Tax Assessment Tax Assessment Total Assessment is a certain percentage of the fair market value that is determined by local assessors to be the total taxable value of land and additions on the property. | Land | Improvement |
|---|---|---|---|---|
| 2025 | $9,254 | $753,334 | $434,564 | $318,770 |
| 2024 | $8,896 | $738,564 | $426,044 | $312,520 |
| 2023 | $8,896 | $724,084 | $417,691 | $306,393 |
| 2022 | $8,820 | $709,887 | $409,501 | $300,386 |
| 2021 | $8,631 | $695,969 | $401,472 | $294,497 |
| 2019 | $8,455 | $675,328 | $389,565 | $285,763 |
| 2018 | $8,159 | $662,087 | $381,927 | $280,160 |
| 2017 | $7,915 | $649,106 | $374,439 | $274,667 |
| 2016 | $7,733 | $636,380 | $367,098 | $269,282 |
| 2015 | $7,678 | $626,822 | $361,584 | $265,238 |
| 2014 | $7,586 | $614,545 | $354,502 | $260,043 |
Source: Public Records
Map
Nearby Homes
- 848 Cumberland Dr
- 1700 Pleasant Hill Rd
- 60 Terra Teresa
- 21 Withers Ct
- 3093 Diablo View Rd
- 2180 Geary Rd Unit 18
- 1903 Via Ferrari
- 3284 Surmont Dr
- 120 Haslemere Ct
- 580 Boyd Rd
- 137 Haslemere Ct
- 102 Providence Place
- 1630 Cayucos Dr
- 1536 Pleasant Hill Rd
- 2080 Essenay Ave
- 120 Arbor View Ln
- 726 Grayson Rd
- 1894 Cannon Dr
- 1762 Holland Cir
- 2641 Larkey Ln
- 110 Random Way
- 437 Cumberland Dr
- 120 Random Way
- 101 Random Way
- 424 Cumberland Dr
- 24 Johns Ct
- 412 Cumberland Dr
- 447 Cumberland Dr
- 12 Stratford Ct
- 1849 Pleasant Hill Rd
- 400 Cumberland Dr
- 111 Random Way
- 36 Johns Ct
- 448 Cumberland Dr
- 17 Stratford Ct
- 854 Cumberland Dr
- 121 Random Way
- 13 Johns Ct
- 861 Wedgewood Ct
- 1855 Pleasant Hill Rd
Your Personal Tour Guide
Ask me questions while you tour the home.