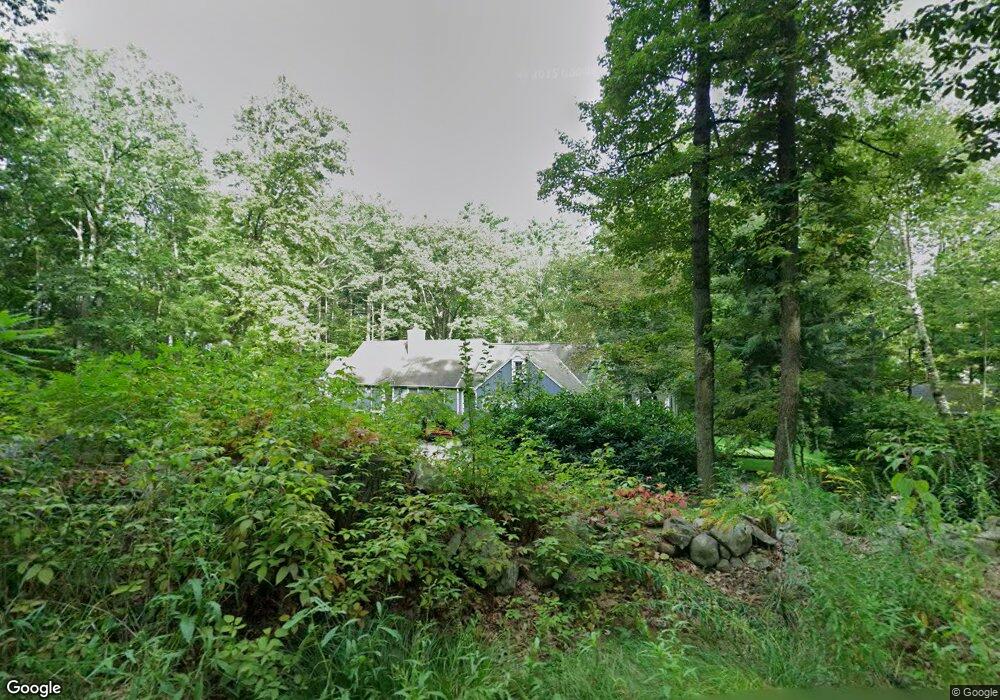
100 Richardson Rd Hollis, NH 03049
Hollis NeighborhoodEstimated Value: $853,000 - $1,154,000
4
Beds
4
Baths
3,607
Sq Ft
$278/Sq Ft
Est. Value
About This Home
This home is located at 100 Richardson Rd, Hollis, NH 03049 and is currently estimated at $1,004,046, approximately $278 per square foot. 100 Richardson Rd is a home located in Hillsborough County with nearby schools including Hollis Primary School, Hollis Upper Elementary School, and Hollis-Brookline Middle School.
Ownership History
Date
Name
Owned For
Owner Type
Purchase Details
Closed on
Mar 13, 2020
Sold by
Lydia J Zhang Ft
Bought by
Horrocks Russell D and Horrocks Alyson
Current Estimated Value
Home Financials for this Owner
Home Financials are based on the most recent Mortgage that was taken out on this home.
Original Mortgage
$510,400
Outstanding Balance
$452,032
Interest Rate
3.5%
Mortgage Type
Purchase Money Mortgage
Estimated Equity
$552,014
Purchase Details
Closed on
Nov 23, 2016
Sold by
Zhang Lydia
Bought by
Lydia Zhang Ft
Purchase Details
Closed on
Aug 16, 2012
Sold by
Nelson Kenric
Bought by
Zhang Lydia
Purchase Details
Closed on
Jun 5, 2007
Sold by
Stephen D Huntley T
Bought by
Nelson Kenric P
Home Financials for this Owner
Home Financials are based on the most recent Mortgage that was taken out on this home.
Original Mortgage
$405,000
Interest Rate
6.24%
Mortgage Type
Purchase Money Mortgage
Create a Home Valuation Report for This Property
The Home Valuation Report is an in-depth analysis detailing your home's value as well as a comparison with similar homes in the area
Home Values in the Area
Average Home Value in this Area
Purchase History
| Date | Buyer | Sale Price | Title Company |
|---|---|---|---|
| Horrocks Russell D | $575,066 | None Available | |
| Lydia Zhang Ft | -- | -- | |
| Zhang Lydia | -- | -- | |
| Nelson Kenric P | $540,000 | -- |
Source: Public Records
Mortgage History
| Date | Status | Borrower | Loan Amount |
|---|---|---|---|
| Open | Horrocks Russell D | $510,400 | |
| Previous Owner | Nelson Kenric P | $405,000 |
Source: Public Records
Tax History Compared to Growth
Tax History
| Year | Tax Paid | Tax Assessment Tax Assessment Total Assessment is a certain percentage of the fair market value that is determined by local assessors to be the total taxable value of land and additions on the property. | Land | Improvement |
|---|---|---|---|---|
| 2024 | $14,556 | $821,000 | $277,600 | $543,400 |
| 2023 | $13,678 | $821,000 | $277,600 | $543,400 |
| 2022 | $18,530 | $821,000 | $277,600 | $543,400 |
| 2021 | $11,609 | $511,400 | $180,700 | $330,700 |
| 2020 | $11,854 | $511,400 | $180,700 | $330,700 |
| 2019 | $11,813 | $511,400 | $180,700 | $330,700 |
| 2018 | $11,063 | $510,500 | $180,700 | $329,800 |
| 2017 | $10,123 | $437,300 | $145,200 | $292,100 |
| 2016 | $10,246 | $437,300 | $145,200 | $292,100 |
| 2015 | $10,753 | $467,100 | $145,200 | $321,900 |
| 2014 | $10,804 | $467,100 | $145,200 | $321,900 |
| 2013 | $10,659 | $467,100 | $145,200 | $321,900 |
Source: Public Records
Map
Nearby Homes
- 100 Richardson Rd
- 100 & 100A Richardson Rd
- 37-8 Lovejoy Ln
- 104 Richardson Rd
- Lot 37-2 Lovejoy
- 97 Richardson Rd
- 108 Richardson Rd
- 3 Lovejoy Ln
- 9 Lovejoy Ln
- 109 Richardson Rd
- 8 Sherwood Dr
- 37-3 Lovejoy Ln
- 10 Lovejoy Ln
- 91 Richardson Rd
- Lot 37-8 Lovejoy
- Lot 37-10 Lovejoy Ln
- Lot 37-9 Lovejoy Ln
- 37-9 Lovejoy Ln
- 37 Lovejoy Ln Unit 9
- 37 Lovejoy Ln Unit 10