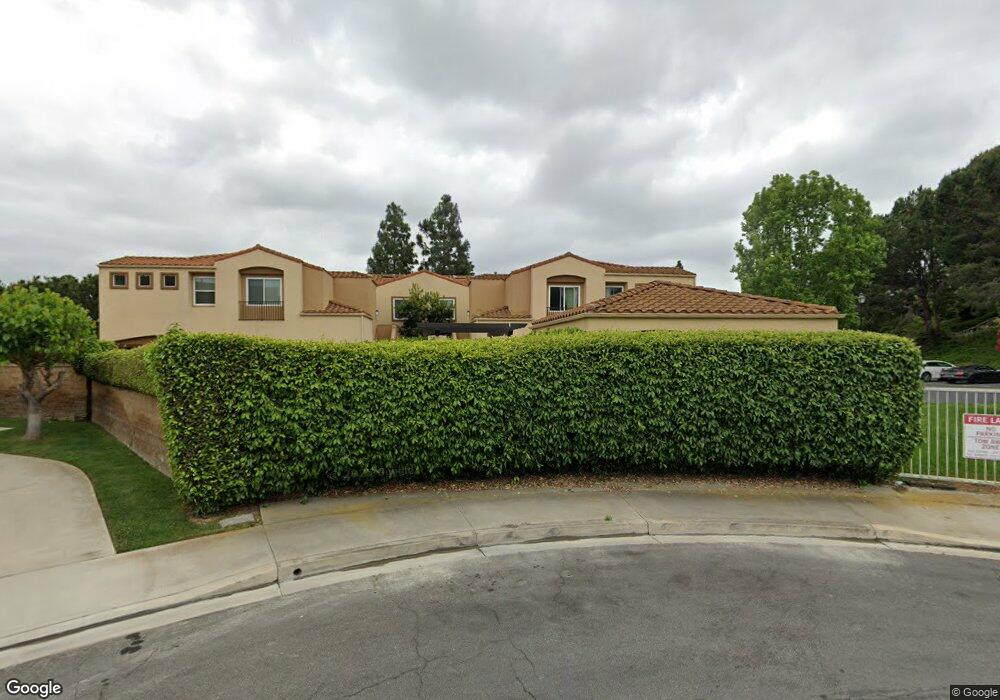
100 Roadrunner Ln Unit 75 Aliso Viejo, CA 92656
Estimated Value: $635,613 - $715,000
2
Beds
2
Baths
925
Sq Ft
$732/Sq Ft
Est. Value
About This Home
This home is located at 100 Roadrunner Ln Unit 75, Aliso Viejo, CA 92656 and is currently estimated at $676,653, approximately $731 per square foot. 100 Roadrunner Ln Unit 75 is a home located in Orange County with nearby schools including Oak Grove Elementary School, Aliso Viejo Middle School, and Aliso Niguel High School.
Ownership History
Date
Name
Owned For
Owner Type
Purchase Details
Closed on
Nov 16, 2018
Sold by
Nichols Patricia
Bought by
Nichols Patricia and Patricia Nichols Revocable Tru
Current Estimated Value
Purchase Details
Closed on
Apr 13, 2000
Sold by
Morahan Ann Marie
Bought by
Nichols Patricia
Home Financials for this Owner
Home Financials are based on the most recent Mortgage that was taken out on this home.
Original Mortgage
$150,700
Outstanding Balance
$49,362
Interest Rate
7.62%
Estimated Equity
$627,291
Purchase Details
Closed on
Sep 27, 1995
Sold by
Lyon Aliso #104 Lp
Bought by
Morahan Ann Marie
Home Financials for this Owner
Home Financials are based on the most recent Mortgage that was taken out on this home.
Original Mortgage
$76,000
Interest Rate
7.59%
Create a Home Valuation Report for This Property
The Home Valuation Report is an in-depth analysis detailing your home's value as well as a comparison with similar homes in the area
Home Values in the Area
Average Home Value in this Area
Purchase History
| Date | Buyer | Sale Price | Title Company |
|---|---|---|---|
| Nichols Patricia | -- | None Available | |
| Nichols Patricia | $167,500 | Guardian Title Company | |
| Morahan Ann Marie | $101,000 | First American Title Ins Co |
Source: Public Records
Mortgage History
| Date | Status | Borrower | Loan Amount |
|---|---|---|---|
| Open | Nichols Patricia | $150,700 | |
| Previous Owner | Morahan Ann Marie | $76,000 |
Source: Public Records
Tax History Compared to Growth
Tax History
| Year | Tax Paid | Tax Assessment Tax Assessment Total Assessment is a certain percentage of the fair market value that is determined by local assessors to be the total taxable value of land and additions on the property. | Land | Improvement |
|---|---|---|---|---|
| 2025 | $2,487 | $257,432 | $142,327 | $115,105 |
| 2024 | $2,487 | $252,385 | $139,536 | $112,849 |
| 2023 | $2,429 | $247,437 | $136,800 | $110,637 |
| 2022 | $2,380 | $242,586 | $134,118 | $108,468 |
| 2021 | $2,332 | $237,830 | $131,488 | $106,342 |
| 2020 | $2,307 | $235,392 | $130,140 | $105,252 |
| 2019 | $2,261 | $230,777 | $127,588 | $103,189 |
| 2018 | $2,215 | $226,252 | $125,086 | $101,166 |
| 2017 | $2,170 | $221,816 | $122,633 | $99,183 |
| 2016 | $2,114 | $217,467 | $120,228 | $97,239 |
| 2015 | $2,444 | $214,201 | $118,422 | $95,779 |
| 2014 | $2,394 | $210,006 | $116,103 | $93,903 |
Source: Public Records
Map
Nearby Homes
- 92 Verdin Ln
- 4023 Calle Sonora Este
- 47 Solitaire Ln
- 4012 Calle Sonora Oeste Unit 1B
- 4018 Calle Sonora Este Unit N
- 4018 Calle Sonora Este
- 4014 Calle Sonora Oeste Unit 2B
- 4009 Calle Sonora Oeste Unit 2H
- 40 Golf Dr
- 29 Sandbridge
- 15 Surfbird Ln
- 71 Waxwing Ln Unit 109
- 4001 Calle Sonora Unit 2B
- 4001 Calle Sonora Unit 3E
- 3 Egret Ln
- 17 Via Athena Unit 49
- 126 Cinnamon Teal
- 1 Nightingale Dr Unit 69
- 24811 Via San Marco
- 28 Sandpiper Ln
- 102 Roadrunner Ln Unit 74
- 98 Roadrunner Ln
- 104 Roadrunner Ln
- 96 Roadrunner Ln
- 94 Roadrunner Ln Unit 76
- 106 Roadrunner Ln
- 92 Roadrunner Ln Unit 81
- 108 Roadrunner Ln
- 110 Roadrunner Ln
- 1 Raven Ln
- 2 Raven Ln
- 3 Raven Ln
- 4 Raven Ln
- 5 Raven Ln
- 82 Verdin Ln Unit 21
- 54 Raven Ln
- 56 Raven Ln
- 84 Verdin Ln
- 52 Raven Ln
- 58 Raven Ln