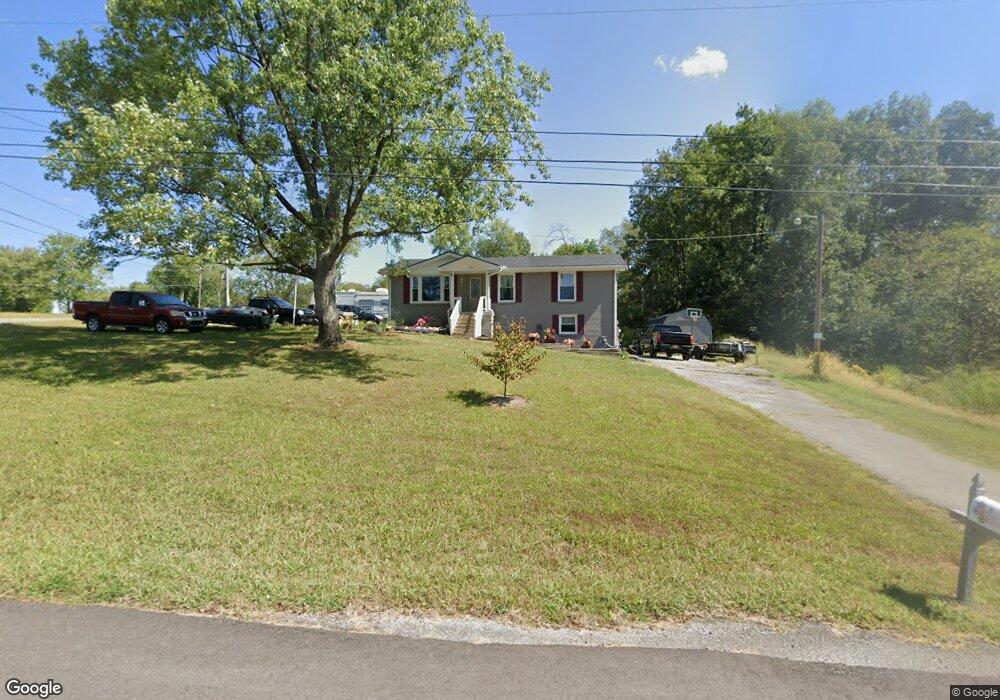
100 Robertson Ave Greenbrier, TN 37073
Estimated Value: $265,686 - $335,000
--
Bed
2
Baths
1,075
Sq Ft
$279/Sq Ft
Est. Value
About This Home
This home is located at 100 Robertson Ave, Greenbrier, TN 37073 and is currently estimated at $299,672, approximately $278 per square foot. 100 Robertson Ave is a home located in Robertson County with nearby schools including Greenbrier Elementary School, Greenbrier Middle School, and Greenbrier High School.
Ownership History
Date
Name
Owned For
Owner Type
Purchase Details
Closed on
Mar 22, 2022
Sold by
Sharpe Kathy D
Bought by
Sharpe Kathy D and Cross Joshua
Current Estimated Value
Home Financials for this Owner
Home Financials are based on the most recent Mortgage that was taken out on this home.
Original Mortgage
$172,000
Outstanding Balance
$161,132
Interest Rate
4.16%
Mortgage Type
New Conventional
Estimated Equity
$138,540
Purchase Details
Closed on
May 19, 2016
Sold by
Davis Jack
Bought by
Sharpe Kathy D
Home Financials for this Owner
Home Financials are based on the most recent Mortgage that was taken out on this home.
Original Mortgage
$125,681
Interest Rate
4.12%
Mortgage Type
FHA
Purchase Details
Closed on
Apr 1, 2010
Sold by
Crague Bobby L
Bought by
Davis Jack
Purchase Details
Closed on
Oct 19, 2004
Sold by
Young Alice K Estate
Bought by
Crague Bobby L and Crague Reta J
Purchase Details
Closed on
Jun 11, 1970
Bought by
Young Robert P
Create a Home Valuation Report for This Property
The Home Valuation Report is an in-depth analysis detailing your home's value as well as a comparison with similar homes in the area
Home Values in the Area
Average Home Value in this Area
Purchase History
| Date | Buyer | Sale Price | Title Company |
|---|---|---|---|
| Sharpe Kathy D | -- | Rosenberg Jay A | |
| Sharpe Kathy D | -- | None Listed On Document | |
| Sharpe Kathy D | $128,000 | -- | |
| Davis Jack | $78,592 | -- | |
| Crague Bobby L | $87,500 | -- | |
| Young Robert P | -- | -- |
Source: Public Records
Mortgage History
| Date | Status | Borrower | Loan Amount |
|---|---|---|---|
| Open | Sharpe Kathy D | $172,000 | |
| Closed | Sharpe Kathy D | $172,000 | |
| Previous Owner | Sharpe Kathy D | $125,681 |
Source: Public Records
Tax History Compared to Growth
Tax History
| Year | Tax Paid | Tax Assessment Tax Assessment Total Assessment is a certain percentage of the fair market value that is determined by local assessors to be the total taxable value of land and additions on the property. | Land | Improvement |
|---|---|---|---|---|
| 2024 | $1,042 | $57,875 | $23,750 | $34,125 |
| 2023 | $1,042 | $57,875 | $23,750 | $34,125 |
| 2022 | $652 | $25,325 | $5,625 | $19,700 |
| 2021 | $601 | $23,350 | $5,625 | $17,725 |
| 2020 | $601 | $23,350 | $5,625 | $17,725 |
| 2019 | $601 | $23,350 | $5,625 | $17,725 |
| 2018 | $601 | $23,350 | $5,625 | $17,725 |
| 2017 | $628 | $20,350 | $4,950 | $15,400 |
| 2016 | $628 | $20,350 | $4,950 | $15,400 |
| 2015 | $602 | $20,350 | $4,950 | $15,400 |
| 2014 | $602 | $20,350 | $4,950 | $15,400 |
Source: Public Records
Map
Nearby Homes
- 3078 Old Greenbrier Pike
- 3146 Old Greenbrier Pike
- 2828 Old Greenbrier Pike
- 6056 Greenbrier Cemetery Rd
- 3225 Pinson School Rd
- 3159 Lights Chapel Rd
- 2967 Lights Chapel Rd
- 1040 Northridge Dr
- 2969 Lights Chapel Rd
- 6109 Ebenezer Rd
- 1014 Sunday Silence Dr
- 6325 Greenbrier Cemetery Rd
- 619 Wilson St
- 4162 Hereford Dr
- 4610 Church St
- 144 Filly Ln
- 4017 Hereford Dr
- 3033 Maitland Dr
- 136 Filly Ln
- 1052 Shadowbrook Dr
- 3019 Highland Dr
- 106 Robertson Ave
- 3017 Highland Dr
- 105 Robertson Ave
- 3021 Highland Dr
- 110 Robertson Ave
- 104 Morris Dr
- 107 Robertson Ave
- 114 Robertson Ave
- 3015 Highland Dr
- 4001 Highland Dr
- 109 Robertson Ave
- 4002 Highland Dr
- 3012 Highland Dr
- 118 Robertson Ave
- 111 Robertson Ave
- 3005 Highland Dr
- 4003 Highland Dr
- 108 Morris Dr
- 120 Robertson Ave