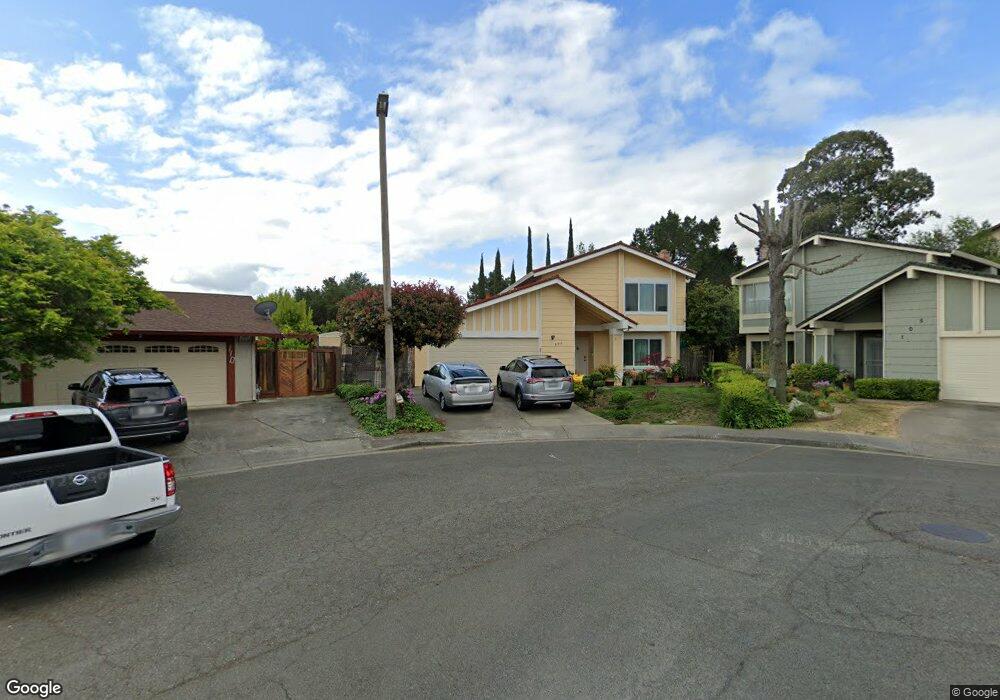
100 Robin Ct Vallejo, CA 94591
Woodridge NeighborhoodEstimated Value: $496,000 - $618,000
4
Beds
3
Baths
1,670
Sq Ft
$343/Sq Ft
Est. Value
About This Home
This home is located at 100 Robin Ct, Vallejo, CA 94591 and is currently estimated at $572,188, approximately $342 per square foot. 100 Robin Ct is a home located in Solano County with nearby schools including Joseph H. Wardlaw Elementary School, Hogan Middle School, and Jesse M. Bethel High School.
Ownership History
Date
Name
Owned For
Owner Type
Purchase Details
Closed on
Mar 31, 2025
Sold by
Cindy Phuong Le Revocable Living Trust and Le Cindy Phuong
Bought by
Le Ta Living Trust and Le
Current Estimated Value
Purchase Details
Closed on
Oct 25, 2001
Sold by
Le Phuong
Bought by
Le Phuong and Le Cindy Phuong
Purchase Details
Closed on
Jun 7, 1996
Sold by
American Svgs Bank Fa
Bought by
Federal Home Loan Mortgage Corporation
Home Financials for this Owner
Home Financials are based on the most recent Mortgage that was taken out on this home.
Original Mortgage
$113,750
Interest Rate
8.01%
Purchase Details
Closed on
Jun 4, 1996
Sold by
Federal Home Loan Mortgage Corporation
Bought by
Le Phuong
Home Financials for this Owner
Home Financials are based on the most recent Mortgage that was taken out on this home.
Original Mortgage
$113,750
Interest Rate
8.01%
Purchase Details
Closed on
Feb 8, 1996
Sold by
Beaudoux George E and Beaudoux Constance H
Bought by
American Svgs Bank
Create a Home Valuation Report for This Property
The Home Valuation Report is an in-depth analysis detailing your home's value as well as a comparison with similar homes in the area
Home Values in the Area
Average Home Value in this Area
Purchase History
| Date | Buyer | Sale Price | Title Company |
|---|---|---|---|
| Le Ta Living Trust | -- | None Listed On Document | |
| Le Phuong | -- | -- | |
| Federal Home Loan Mortgage Corporation | -- | First American Title Guarant | |
| Le Phuong | $162,500 | First American Title Guarant | |
| American Svgs Bank | $160,000 | -- |
Source: Public Records
Mortgage History
| Date | Status | Borrower | Loan Amount |
|---|---|---|---|
| Previous Owner | Le Phuong | $113,750 |
Source: Public Records
Tax History
| Year | Tax Paid | Tax Assessment Tax Assessment Total Assessment is a certain percentage of the fair market value that is determined by local assessors to be the total taxable value of land and additions on the property. | Land | Improvement |
|---|---|---|---|---|
| 2025 | $4,242 | $269,951 | $74,755 | $195,196 |
| 2024 | $4,242 | $264,659 | $73,290 | $191,369 |
| 2023 | $3,993 | $259,470 | $71,853 | $187,617 |
| 2022 | $3,891 | $254,384 | $70,445 | $183,939 |
| 2021 | $3,804 | $249,397 | $69,064 | $180,333 |
| 2020 | $3,813 | $246,840 | $68,356 | $178,484 |
| 2019 | $3,693 | $242,001 | $67,016 | $174,985 |
| 2018 | $3,461 | $237,256 | $65,702 | $171,554 |
| 2017 | $3,306 | $232,605 | $64,414 | $168,191 |
| 2016 | $2,719 | $228,045 | $63,151 | $164,894 |
| 2015 | $2,681 | $224,621 | $62,203 | $162,418 |
| 2014 | $2,642 | $220,222 | $60,985 | $159,237 |
Source: Public Records
Map
Nearby Homes
- 272 Woodridge Dr
- 1213 Hale St
- 124 Gregory Ln
- 136 Evergreen Way
- 367 Darley Dr
- 2512 Tennessee St
- 373 Clydesdale Dr
- 112 Palomar Ln
- 216 Manhattan Dr
- 104 Foster St
- 1509 Lassen Ct
- 2890 Redwood Pkwy Unit 61
- 278 Cadloni Ln
- 108 Revere St
- 151 Kathy Ellen Ct
- 103 Stageline Ct
- 129 Revere St
- 164 Kathy Ellen Dr
- 103 Sandalwood Ct
- 155 White Pine Dr
Your Personal Tour Guide
Ask me questions while you tour the home.