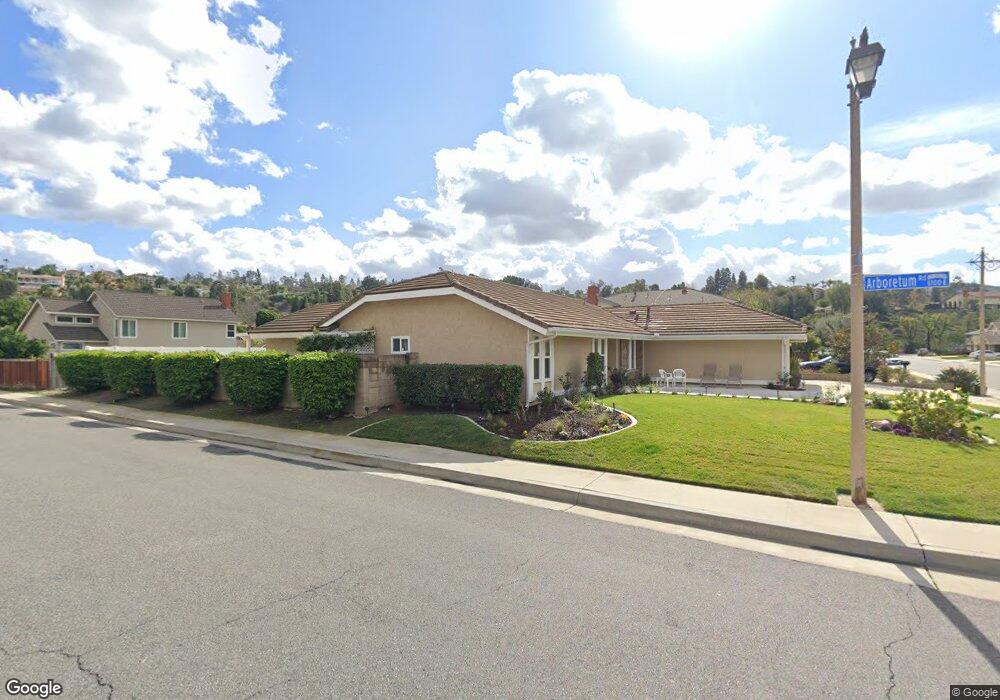
100 S Bayberry Ct Anaheim, CA 92807
Anaheim Hills NeighborhoodEstimated Value: $1,187,000 - $1,354,000
3
Beds
2
Baths
1,876
Sq Ft
$683/Sq Ft
Est. Value
About This Home
This home is located at 100 S Bayberry Ct, Anaheim, CA 92807 and is currently estimated at $1,282,245, approximately $683 per square foot. 100 S Bayberry Ct is a home located in Orange County with nearby schools including Crescent Elementary School, Canyon High School, and El Rancho Charter.
Ownership History
Date
Name
Owned For
Owner Type
Purchase Details
Closed on
Apr 17, 2025
Sold by
Gary E Bruce Revocable Trust and Bruce Keri K
Bought by
Urena Isabella and Urena Savannah
Current Estimated Value
Purchase Details
Closed on
Feb 27, 2025
Sold by
Bruce Keri K and Clark Whitney M
Bought by
Gary E Bruce Revocable Trust and Bruce
Purchase Details
Closed on
Jan 29, 2025
Sold by
Gary E Bruce Revocable Trust and Bruce Keri K
Bought by
Bruce Keri K and Urena Isabella
Purchase Details
Closed on
Feb 12, 2020
Sold by
Bruce Gary E
Bought by
Bruce Gary E and Gary E Bruce Revocable Trust
Purchase Details
Closed on
Dec 28, 2017
Sold by
Bruce Gary Earl
Bought by
Bruce Gary Earl
Purchase Details
Closed on
Apr 5, 2001
Sold by
Bruce Gary Earl
Bought by
Bruce Gary Earl and Bruce Kathleen Gail
Purchase Details
Closed on
Dec 1, 1998
Sold by
Bruce Gary E
Bought by
Bruce Gary S
Create a Home Valuation Report for This Property
The Home Valuation Report is an in-depth analysis detailing your home's value as well as a comparison with similar homes in the area
Home Values in the Area
Average Home Value in this Area
Purchase History
| Date | Buyer | Sale Price | Title Company |
|---|---|---|---|
| Urena Isabella | -- | None Listed On Document | |
| Gary E Bruce Revocable Trust | -- | None Listed On Document | |
| Bruce Keri K | -- | None Listed On Document | |
| Gary E Bruce Revocable Trust | -- | None Listed On Document | |
| Bruce Gary E | -- | None Available | |
| Bruce Gary Earl | -- | None Available | |
| Bruce Gary Earl | -- | -- | |
| Bruce Gary S | -- | Old Republic Title Company | |
| Bruce Gary E | -- | Old Republic Title Company |
Source: Public Records
Tax History Compared to Growth
Tax History
| Year | Tax Paid | Tax Assessment Tax Assessment Total Assessment is a certain percentage of the fair market value that is determined by local assessors to be the total taxable value of land and additions on the property. | Land | Improvement |
|---|---|---|---|---|
| 2025 | $6,229 | $713,578 | $488,218 | $225,360 |
| 2024 | $6,229 | $559,185 | $341,670 | $217,515 |
| 2023 | $6,090 | $548,221 | $334,971 | $213,250 |
| 2022 | $5,970 | $537,472 | $328,403 | $209,069 |
| 2021 | $5,803 | $526,934 | $321,964 | $204,970 |
| 2020 | $5,749 | $521,531 | $318,662 | $202,869 |
| 2019 | $5,675 | $511,305 | $312,413 | $198,892 |
| 2018 | $5,588 | $501,280 | $306,287 | $194,993 |
| 2017 | $5,356 | $491,451 | $300,281 | $191,170 |
| 2016 | $5,251 | $481,815 | $294,393 | $187,422 |
| 2015 | $5,182 | $474,578 | $289,971 | $184,607 |
| 2014 | $5,071 | $465,282 | $284,291 | $180,991 |
Source: Public Records
Map
Nearby Homes
- 131 S Francisco St
- 157 S Donna Ct
- 242 N Camino Arroyo
- 397 S San Vicente Ln Unit 31
- 6189 E Camino Manzano
- 7350 E Calle Durango
- 5901 E Firenze Crescent
- 6587 E Via Arboles
- 6554 E Via Estrada
- 5997 E Calle Principia
- 6093 E Brighton Ln
- 5815 E La Palma Ave Unit 74
- 5815 E La Palma Ave Unit 190
- 5815 E La Palma Ave Unit 133
- 396 Auburn Heights
- 5984 E Avenida la Vida
- 6070 E Summit Ct Unit 48
- 562 S Covered Wagon Trail
- 7583 E Country Hill Ln
- 6821 Rocky Grove Ct Unit 13
- 110 S Bayberry Ct
- 105 S Bonnie Gene Ln
- 115 S Bonnie Gene Ln
- 6166 E Palo Alto Dr
- 120 S Bayberry Ct
- 6170 E Palo Alto Dr
- 6130 E Arboretum Rd
- 6160 E Palo Alto Dr
- 125 S Bonnie Gene Ln
- 6178 E Palo Alto Dr
- 111 S Bayberry Ct
- 130 S Bayberry Ct
- 6152 E Palo Alto Dr
- 6120 E Arboretum Rd
- 121 S Bayberry Ct
- 6184 E Palo Alto Dr
- 135 S Bonnie Gene Ln
- 6170 E Arboretum Rd
- 150 S Bonnie Gene Ln
- 140 S Bayberry Ct