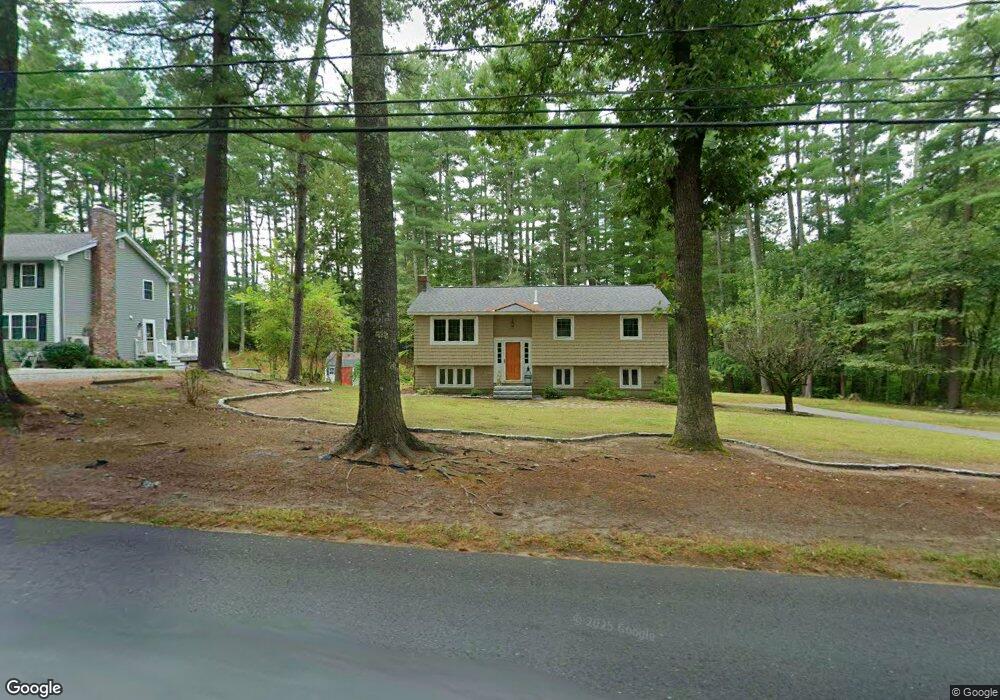
100 S Harbor Rd Townsend, MA 01469
Estimated Value: $450,377 - $476,000
3
Beds
1
Bath
1,318
Sq Ft
$353/Sq Ft
Est. Value
About This Home
This home is located at 100 S Harbor Rd, Townsend, MA 01469 and is currently estimated at $465,094, approximately $352 per square foot. 100 S Harbor Rd is a home located in Middlesex County with nearby schools including North Middlesex Regional High School.
Ownership History
Date
Name
Owned For
Owner Type
Purchase Details
Closed on
Aug 22, 2022
Sold by
Sanborn Judith A
Bought by
Judith A Sanborn Irt and Sanborn
Current Estimated Value
Purchase Details
Closed on
Jun 9, 2006
Sold by
Sanborn Don E
Bought by
Sanborn Don E and Sanborn Judithe A
Create a Home Valuation Report for This Property
The Home Valuation Report is an in-depth analysis detailing your home's value as well as a comparison with similar homes in the area
Home Values in the Area
Average Home Value in this Area
Purchase History
| Date | Buyer | Sale Price | Title Company |
|---|---|---|---|
| Judith A Sanborn Irt | -- | None Available | |
| Sanborn Don E | -- | -- |
Source: Public Records
Tax History Compared to Growth
Tax History
| Year | Tax Paid | Tax Assessment Tax Assessment Total Assessment is a certain percentage of the fair market value that is determined by local assessors to be the total taxable value of land and additions on the property. | Land | Improvement |
|---|---|---|---|---|
| 2025 | $5,300 | $365,000 | $90,700 | $274,300 |
| 2024 | $5,153 | $357,600 | $90,700 | $266,900 |
| 2023 | $4,723 | $309,500 | $78,300 | $231,200 |
| 2022 | $4,892 | $277,800 | $71,700 | $206,100 |
| 2021 | $4,637 | $253,000 | $70,900 | $182,100 |
| 2020 | $4,620 | $236,700 | $64,300 | $172,400 |
| 2019 | $4,320 | $223,500 | $64,300 | $159,200 |
| 2018 | $4,176 | $206,100 | $57,700 | $148,400 |
| 2017 | $3,956 | $201,100 | $60,600 | $140,500 |
| 2016 | $3,770 | $190,400 | $60,600 | $129,800 |
| 2015 | $3,530 | $184,700 | $67,200 | $117,500 |
| 2014 | $3,294 | $168,300 | $63,100 | $105,200 |
Source: Public Records
Map
Nearby Homes
- 5 Chestnut Dr
- 18 Beech St
- 28 Beech St
- 31 South St
- 144 Main St
- 64 Maplewood Dr
- 2 Tamarack Ln
- 1 Depot Street Extension Unit 2
- 1 Depot Street Extension Unit 5
- 1 Depot Street Extension Unit 3
- 1 Depot Street Extension Unit 4
- 91 Highland St
- 75 Highland St
- 10 Stearns Ave
- 18 Crosswinds Dr
- 20 Bayberry Hill Rd
- 00 Tyler Rd
- Lot 10 Christian Cir
- 10 Hillside St
- 55 Beachview Rd