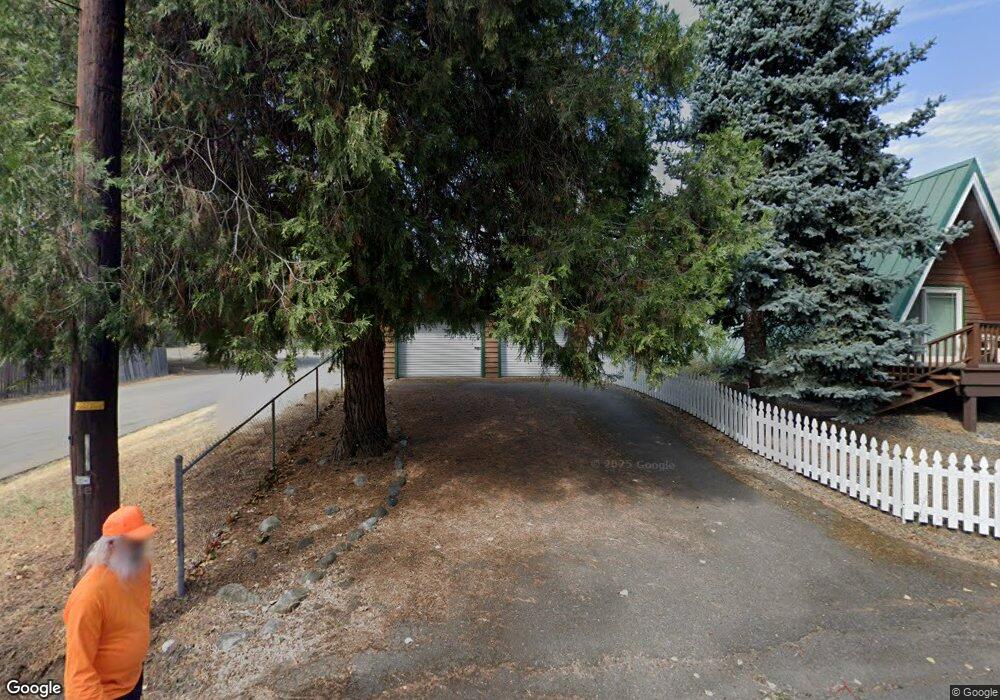
100 S Miner St Weaverville, CA 96093
Estimated Value: $155,000 - $197,455
1
Bed
1
Bath
735
Sq Ft
$243/Sq Ft
Est. Value
About This Home
This home is located at 100 S Miner St, Weaverville, CA 96093 and is currently estimated at $178,614, approximately $243 per square foot. 100 S Miner St is a home with nearby schools including Weaverville Elementary School and Trinity High School.
Ownership History
Date
Name
Owned For
Owner Type
Purchase Details
Closed on
Nov 7, 2013
Sold by
Howard Marc D and Howard Dawn R
Bought by
Howard Marc D and Howard Dawn R
Current Estimated Value
Purchase Details
Closed on
Mar 7, 2012
Sold by
Firestein Clyde O and Firestein Anadilia R
Bought by
Howard Marc D and Howard Dawn R
Purchase Details
Closed on
Aug 4, 2008
Sold by
Firestein Clyde O and Firestein Anadilia R
Bought by
Firestein Clyde O and Firestein Anadilia R
Purchase Details
Closed on
Sep 11, 2007
Sold by
Firestein Anadilia R
Bought by
Firestein Clyde O
Home Financials for this Owner
Home Financials are based on the most recent Mortgage that was taken out on this home.
Original Mortgage
$95,400
Interest Rate
6.57%
Mortgage Type
Stand Alone Refi Refinance Of Original Loan
Purchase Details
Closed on
Jan 14, 2004
Sold by
Thompson Steve and Thompson Melody
Bought by
Firestein Clyde O
Create a Home Valuation Report for This Property
The Home Valuation Report is an in-depth analysis detailing your home's value as well as a comparison with similar homes in the area
Home Values in the Area
Average Home Value in this Area
Purchase History
| Date | Buyer | Sale Price | Title Company |
|---|---|---|---|
| Howard Marc D | -- | None Available | |
| Howard Marc D | $87,000 | Trinity Co Title Co | |
| Firestein Clyde O | -- | Trinity Co Title Co | |
| Firestein Clyde O | -- | First American Title Co | |
| Firestein Clyde O | $87,500 | First American Title Co |
Source: Public Records
Mortgage History
| Date | Status | Borrower | Loan Amount |
|---|---|---|---|
| Previous Owner | Firestein Clyde O | $95,400 |
Source: Public Records
Tax History Compared to Growth
Tax History
| Year | Tax Paid | Tax Assessment Tax Assessment Total Assessment is a certain percentage of the fair market value that is determined by local assessors to be the total taxable value of land and additions on the property. | Land | Improvement |
|---|---|---|---|---|
| 2025 | $1,148 | $109,262 | $25,114 | $84,148 |
| 2024 | $1,129 | $107,121 | $24,622 | $82,499 |
| 2023 | $1,129 | $105,022 | $24,140 | $80,882 |
| 2022 | $1,104 | $102,964 | $23,667 | $79,297 |
| 2021 | $1,086 | $100,946 | $23,203 | $77,743 |
| 2020 | $1,038 | $99,912 | $22,966 | $76,946 |
| 2019 | $1,018 | $97,954 | $22,516 | $75,438 |
| 2018 | $985 | $96,034 | $22,075 | $73,959 |
| 2017 | $982 | $94,152 | $21,643 | $72,509 |
| 2016 | $943 | $92,307 | $21,219 | $71,088 |
| 2015 | $929 | $90,922 | $20,901 | $70,021 |
| 2014 | $916 | $89,142 | $20,492 | $68,650 |
Source: Public Records
Map
Nearby Homes