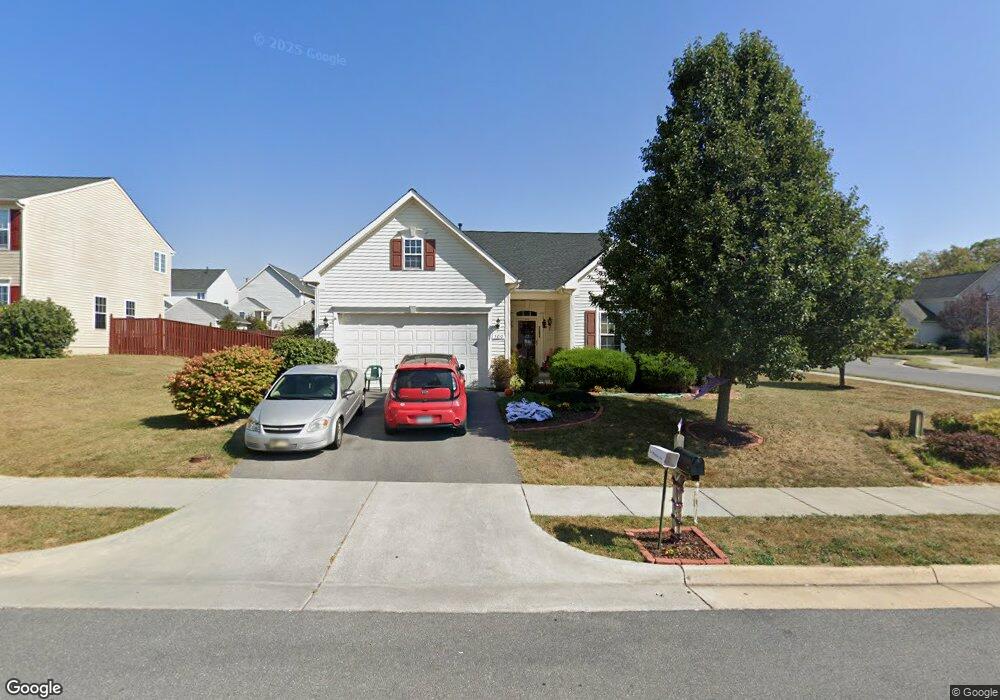
100 Shoe Buckle Ct Stephens City, VA 22655
Estimated Value: $466,000 - $503,063
4
Beds
3
Baths
2,300
Sq Ft
$212/Sq Ft
Est. Value
About This Home
This home is located at 100 Shoe Buckle Ct, Stephens City, VA 22655 and is currently estimated at $487,516, approximately $211 per square foot. 100 Shoe Buckle Ct is a home located in Frederick County with nearby schools including Middletown Elementary School, Robert E. Aylor Middle School, and Sherando High School.
Ownership History
Date
Name
Owned For
Owner Type
Purchase Details
Closed on
Nov 18, 2024
Sold by
Jacques Lauren St and Riley Scott
Bought by
Been Mary Leslie
Current Estimated Value
Home Financials for this Owner
Home Financials are based on the most recent Mortgage that was taken out on this home.
Original Mortgage
$160,000
Outstanding Balance
$158,407
Interest Rate
6.12%
Mortgage Type
New Conventional
Estimated Equity
$329,109
Purchase Details
Closed on
Mar 24, 2023
Sold by
Riley Norma J
Bought by
Riley Norma J and St Jacques Lauren
Purchase Details
Closed on
Oct 23, 2006
Sold by
Nvr Inc
Bought by
Riley Russell H
Home Financials for this Owner
Home Financials are based on the most recent Mortgage that was taken out on this home.
Original Mortgage
$107,000
Interest Rate
6.49%
Mortgage Type
New Conventional
Purchase Details
Closed on
Jul 24, 2006
Sold by
Long Stephens City I L L
Bought by
Nvr Inc
Create a Home Valuation Report for This Property
The Home Valuation Report is an in-depth analysis detailing your home's value as well as a comparison with similar homes in the area
Home Values in the Area
Average Home Value in this Area
Purchase History
| Date | Buyer | Sale Price | Title Company |
|---|---|---|---|
| Been Mary Leslie | $450,000 | Clear Title | |
| Riley Norma J | -- | None Listed On Document | |
| Riley Russell H | $351,000 | -- | |
| Nvr Inc | $150,000 | -- |
Source: Public Records
Mortgage History
| Date | Status | Borrower | Loan Amount |
|---|---|---|---|
| Open | Been Mary Leslie | $160,000 | |
| Previous Owner | Riley Russell H | $107,000 |
Source: Public Records
Tax History Compared to Growth
Tax History
| Year | Tax Paid | Tax Assessment Tax Assessment Total Assessment is a certain percentage of the fair market value that is determined by local assessors to be the total taxable value of land and additions on the property. | Land | Improvement |
|---|---|---|---|---|
| 2025 | $2,462 | $512,900 | $93,000 | $419,900 |
| 2024 | $1,121 | $439,800 | $77,000 | $362,800 |
| 2023 | $2,243 | $439,800 | $77,000 | $362,800 |
| 2022 | $2,059 | $337,500 | $72,000 | $265,500 |
| 2021 | $2,059 | $337,500 | $72,000 | $265,500 |
| 2020 | $1,857 | $304,500 | $72,000 | $232,500 |
| 2019 | $1,857 | $304,500 | $72,000 | $232,500 |
| 2018 | $1,773 | $290,600 | $72,000 | $218,600 |
| 2017 | $1,744 | $290,600 | $72,000 | $218,600 |
| 2016 | $1,595 | $265,900 | $59,500 | $206,400 |
| 2015 | $1,489 | $265,900 | $59,500 | $206,400 |
| 2014 | $715 | $242,400 | $59,500 | $182,900 |
Source: Public Records
Map
Nearby Homes
- 5350 Water St
- 112 Smoke House Ct
- 5362 Germain St
- 148 Pittman Ct
- 135 Pittman Ct
- 5378 Main St
- 113 Pittman Ct
- 5342 Main St
- 1183 Fairfax St
- 1597 Fairfax St
- 0 Stickley Dr
- 121 Harmon Place
- 5051 Barley Dr
- 406 Carroll Dr
- Lot 1B Double Church Rd
- 147 Westchester Dr
- 0 Valley Pike Unit VAFV2019824
- 0 Valley Pike Unit VAFV2020122
- 0 Valley Pike Unit VAFV2020124
- 0 Valley Pike Unit VAFV2020126
- 102 Shoe Buckle Ct
- 229 Stephens Run St
- 1069 Fairfax St
- 224 Stephens Run St
- 101 Shoe Buckle Ct
- 104 Shoe Buckle Ct
- 222 Stephens Run St
- 1073 Fairfax St
- 103 Shoe Buckle Ct
- 226 Stephens Run St
- 1077 Fairfax St
- 228 Stephens Run St
- 220 Stephens Run St
- 105 Shoe Buckle Ct
- 1081 Fairfax St
- 200 Shoe Buckle Ct
- 1031 Fairfax St
- 5441 Germain St
- 100 Smoke House Ct
- 102 Smoke House Ct