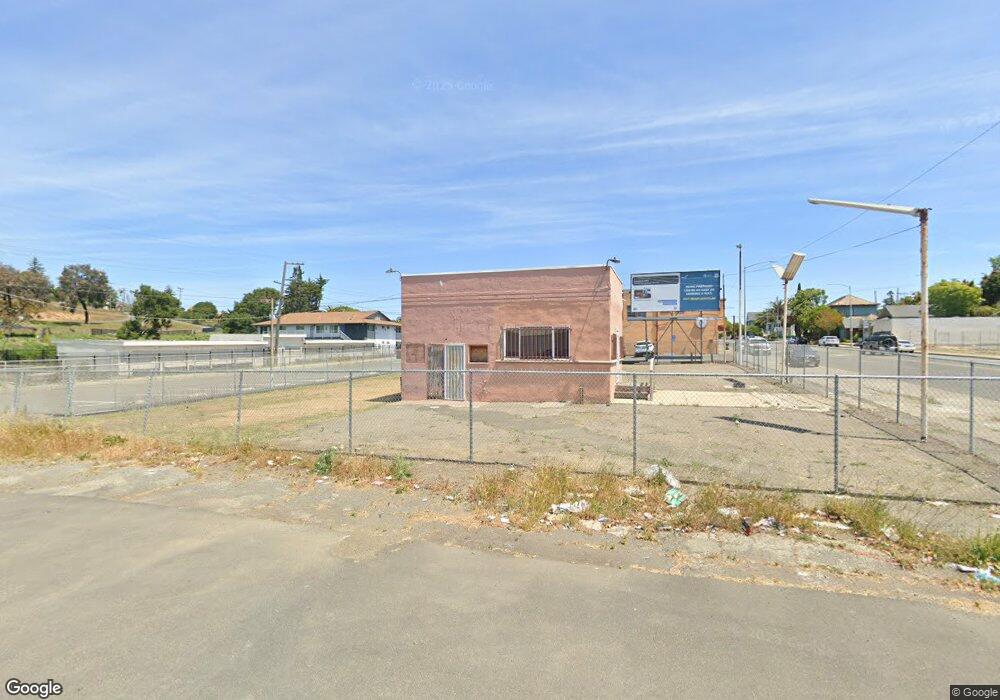
100 Tennessee St Vallejo, CA 94590
Vallejo Heights NeighborhoodEstimated Value: $351,936
--
Bed
--
Bath
--
Sq Ft
7,841
Sq Ft Lot
About This Home
This home is located at 100 Tennessee St, Vallejo, CA 94590 and is currently estimated at $351,936. 100 Tennessee St is a home located in Solano County with nearby schools including Mare Island Health And Fitness Academy, Vallejo High School, and Caliber: ChangeMakers Academy.
Ownership History
Date
Name
Owned For
Owner Type
Purchase Details
Closed on
May 24, 2017
Sold by
Crain Sandra L
Bought by
Crain William H
Current Estimated Value
Purchase Details
Closed on
Nov 18, 2014
Sold by
Conger Anna M
Bought by
Rocio Ana Ramos C
Home Financials for this Owner
Home Financials are based on the most recent Mortgage that was taken out on this home.
Original Mortgage
$25,500
Interest Rate
4.1%
Mortgage Type
Purchase Money Mortgage
Purchase Details
Closed on
Dec 14, 2012
Sold by
Conger David L and Conger Anna M
Bought by
Conger Anna M
Purchase Details
Closed on
Nov 14, 2011
Sold by
Conger Dave
Bought by
Conger David L and Conger Anna M
Purchase Details
Closed on
Aug 19, 2003
Sold by
Conger Dave and Priest Verna Sharon
Bought by
Conger Dave
Create a Home Valuation Report for This Property
The Home Valuation Report is an in-depth analysis detailing your home's value as well as a comparison with similar homes in the area
Home Values in the Area
Average Home Value in this Area
Purchase History
| Date | Buyer | Sale Price | Title Company |
|---|---|---|---|
| Crain William H | -- | Fidelity National Title Co | |
| Crain William H | $240,000 | Fidelity National Title Co | |
| Rocio Ana Ramos C | $35,500 | Old Republic Title Company | |
| Conger Anna M | -- | None Available | |
| Conger David L | -- | None Available | |
| Conger Dave | $20,000 | Placer Title Co | |
| Conger Dave | -- | Placer Title Co |
Source: Public Records
Mortgage History
| Date | Status | Borrower | Loan Amount |
|---|---|---|---|
| Previous Owner | Rocio Ana Ramos C | $25,500 |
Source: Public Records
Tax History Compared to Growth
Tax History
| Year | Tax Paid | Tax Assessment Tax Assessment Total Assessment is a certain percentage of the fair market value that is determined by local assessors to be the total taxable value of land and additions on the property. | Land | Improvement |
|---|---|---|---|---|
| 2025 | $3,155 | $278,533 | $277,377 | $1,156 |
| 2024 | $3,155 | $273,073 | $271,939 | $1,134 |
| 2023 | $3,042 | $267,719 | $266,607 | $1,112 |
| 2022 | $3,066 | $262,471 | $261,380 | $1,091 |
| 2021 | $3,084 | $257,325 | $256,255 | $1,070 |
| 2020 | $3,131 | $254,688 | $253,628 | $1,060 |
| 2019 | $3,744 | $249,695 | $248,655 | $1,040 |
| 2018 | $3,505 | $244,800 | $243,780 | $1,020 |
| 2017 | $1,046 | $36,761 | $36,761 | $0 |
| 2016 | $970 | $36,041 | $36,041 | $0 |
| 2015 | $534 | $35,500 | $35,500 | $0 |
| 2014 | $1,144 | $95,647 | $80,917 | $14,730 |
Source: Public Records
Map
Nearby Homes
- 1211 Santa Clara St
- 178 Farragut Ave
- 1909 Sacramento St
- 124 Louisiana St
- 324 Ohio St
- 516 Hichborn St
- 620 Hichborn St
- 1615 Marin St
- 124 Illinois St
- 332 Kentucky St
- 104 Baxter St
- 241 Kentucky St
- 317 Kentucky St
- 309 Coughlan St
- 247 Coughlan St
- 1821 Marin St
- 1800 Santa Clara St
- 31 Kentucky St
- 914 Sacramento St
- 601 Alabama St
- 48 Tennessee St
- 120 Tennessee St
- 38 Tennessee St
- 126 Tennessee St
- 1014 Branciforte St
- 1007 Branciforte St
- 8 Santa Paula Way
- 9 Buena Vista Ave
- 23 Tennessee St
- 1313 Santa Clara St
- 202 Alabama St
- 11 Buena Vista Ave
- 224 Alabama St
- 5 Buena Vista Ave
- 140 Alabama St
- 1321 Santa Clara St
- 130 Alabama St
- 228 Alabama St
- 10 Santa Paula Way