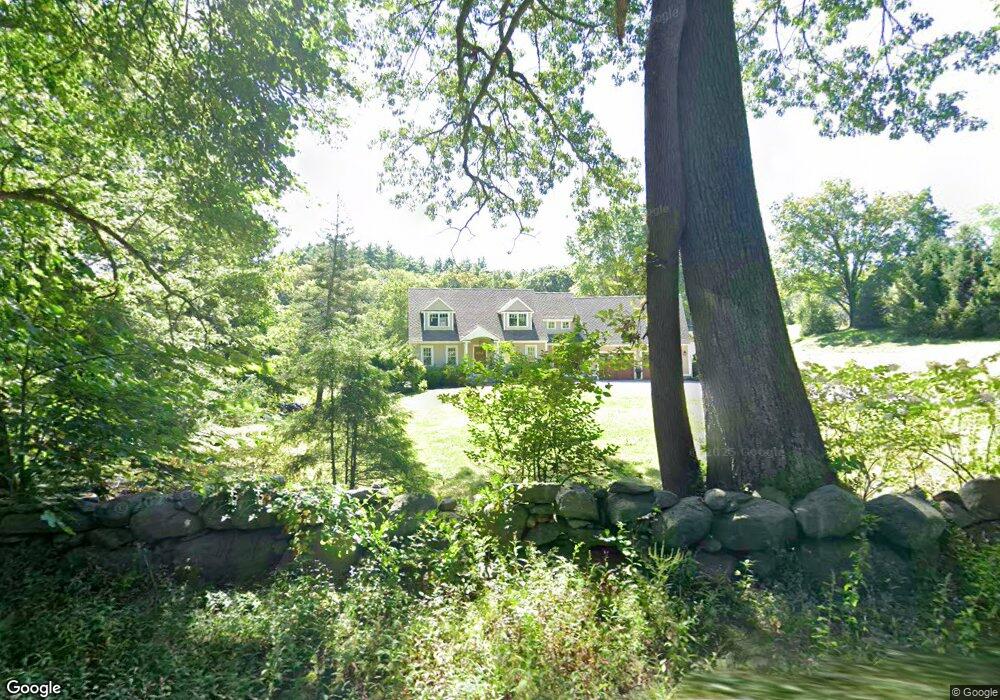
100 Twiss Ln Hollis, NH 03049
Hollis NeighborhoodEstimated Value: $839,000 - $1,103,000
3
Beds
3
Baths
2,828
Sq Ft
$325/Sq Ft
Est. Value
About This Home
This home is located at 100 Twiss Ln, Hollis, NH 03049 and is currently estimated at $918,836, approximately $324 per square foot. 100 Twiss Ln is a home located in Hillsborough County with nearby schools including Hollis Primary School, Hollis Upper Elementary School, and Hollis-Brookline Middle School.
Ownership History
Date
Name
Owned For
Owner Type
Purchase Details
Closed on
Dec 29, 2021
Sold by
Campbell Stewart J and Campbell Camillen
Bought by
Campbell Ft
Current Estimated Value
Purchase Details
Closed on
Sep 4, 2008
Sold by
Zukowski Susan M
Bought by
Campbell Stewart J and Campbell Camille N
Home Financials for this Owner
Home Financials are based on the most recent Mortgage that was taken out on this home.
Original Mortgage
$194,000
Interest Rate
6.69%
Mortgage Type
Purchase Money Mortgage
Create a Home Valuation Report for This Property
The Home Valuation Report is an in-depth analysis detailing your home's value as well as a comparison with similar homes in the area
Home Values in the Area
Average Home Value in this Area
Purchase History
| Date | Buyer | Sale Price | Title Company |
|---|---|---|---|
| Campbell Ft | -- | None Available | |
| Campbell Stewart J | $394,000 | -- |
Source: Public Records
Mortgage History
| Date | Status | Borrower | Loan Amount |
|---|---|---|---|
| Previous Owner | Campbell Canille N | $250,000 | |
| Previous Owner | Campbell Stewart J | $183,000 | |
| Previous Owner | Campbell Stewart J | $194,000 |
Source: Public Records
Tax History Compared to Growth
Tax History
| Year | Tax Paid | Tax Assessment Tax Assessment Total Assessment is a certain percentage of the fair market value that is determined by local assessors to be the total taxable value of land and additions on the property. | Land | Improvement |
|---|---|---|---|---|
| 2024 | $13,521 | $762,600 | $282,200 | $480,400 |
| 2023 | $12,705 | $762,600 | $282,200 | $480,400 |
| 2022 | $17,212 | $762,600 | $282,200 | $480,400 |
| 2021 | $10,855 | $478,200 | $184,900 | $293,300 |
| 2020 | $11,085 | $478,200 | $184,900 | $293,300 |
| 2019 | $11,046 | $478,200 | $184,900 | $293,300 |
| 2018 | $10,363 | $478,200 | $184,900 | $293,300 |
| 2017 | $10,133 | $437,700 | $160,300 | $277,400 |
| 2016 | $10,255 | $437,700 | $160,300 | $277,400 |
| 2015 | $10,076 | $437,700 | $160,300 | $277,400 |
| 2014 | $10,122 | $437,600 | $160,200 | $277,400 |
| 2013 | $9,986 | $437,600 | $160,200 | $277,400 |
Source: Public Records
Map
Nearby Homes