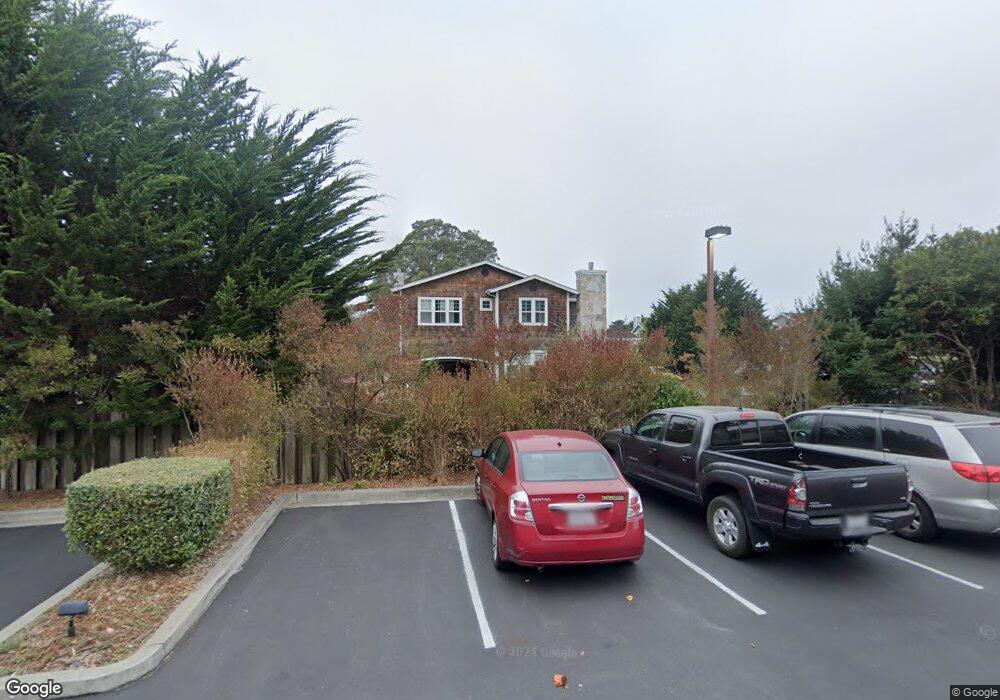
100 Valencia St Half Moon Bay, CA 94019
Estimated Value: $2,347,000 - $3,130,311
5
Beds
4
Baths
3,150
Sq Ft
$898/Sq Ft
Est. Value
About This Home
This home is located at 100 Valencia St, Half Moon Bay, CA 94019 and is currently estimated at $2,827,828, approximately $897 per square foot. 100 Valencia St is a home located in San Mateo County with nearby schools including El Granada Elementary School, Manuel F. Cunha Intermediate School, and Half Moon Bay High School.
Ownership History
Date
Name
Owned For
Owner Type
Purchase Details
Closed on
Jun 16, 2008
Sold by
Chase Denton Summers and Chase Catherine M
Bought by
Chase Denton S and Chase Catherine M
Current Estimated Value
Purchase Details
Closed on
Jun 22, 2004
Sold by
Krupa Patrick A and Krupa Kristine A
Bought by
Chase Denton Summers and Chase Catherine M
Home Financials for this Owner
Home Financials are based on the most recent Mortgage that was taken out on this home.
Original Mortgage
$888,750
Outstanding Balance
$405,075
Interest Rate
5%
Mortgage Type
Purchase Money Mortgage
Estimated Equity
$2,422,753
Purchase Details
Closed on
Jan 23, 2001
Sold by
Turner Home Services Inc
Bought by
Krupa Patrick A and Krupa Kristine A
Home Financials for this Owner
Home Financials are based on the most recent Mortgage that was taken out on this home.
Original Mortgage
$776,000
Interest Rate
7.41%
Create a Home Valuation Report for This Property
The Home Valuation Report is an in-depth analysis detailing your home's value as well as a comparison with similar homes in the area
Home Values in the Area
Average Home Value in this Area
Purchase History
| Date | Buyer | Sale Price | Title Company |
|---|---|---|---|
| Chase Denton S | -- | None Available | |
| Chase Denton Summers | $1,185,000 | Old Republic Title Company | |
| Krupa Patrick A | $970,000 | Old Republic Title Company |
Source: Public Records
Mortgage History
| Date | Status | Borrower | Loan Amount |
|---|---|---|---|
| Open | Chase Denton Summers | $888,750 | |
| Previous Owner | Krupa Patrick A | $776,000 |
Source: Public Records
Tax History Compared to Growth
Tax History
| Year | Tax Paid | Tax Assessment Tax Assessment Total Assessment is a certain percentage of the fair market value that is determined by local assessors to be the total taxable value of land and additions on the property. | Land | Improvement |
|---|---|---|---|---|
| 2025 | $19,273 | $1,684,810 | $842,405 | $842,405 |
| 2023 | $19,273 | $1,619,390 | $809,695 | $809,695 |
| 2022 | $18,267 | $1,587,638 | $793,819 | $793,819 |
| 2021 | $17,862 | $1,556,508 | $778,254 | $778,254 |
| 2020 | $17,861 | $1,540,548 | $770,274 | $770,274 |
| 2019 | $17,931 | $1,510,342 | $755,171 | $755,171 |
| 2018 | $16,726 | $1,480,728 | $740,364 | $740,364 |
| 2017 | $16,496 | $1,451,696 | $725,848 | $725,848 |
| 2016 | $16,302 | $1,423,232 | $711,616 | $711,616 |
| 2015 | $15,921 | $1,401,854 | $700,927 | $700,927 |
| 2014 | $15,507 | $1,374,394 | $687,197 | $687,197 |
Source: Public Records
Map
Nearby Homes
- 71 Alameda Ave
- 404 Roosevelt Blvd
- 416 Lee Ave
- 2786 Pullman Ave
- 404 Lee Ave
- 533 Alto Ave
- 0 3rd Ave Unit ML82006496
- 590 Miramar Dr
- 424 6th Ave
- 318 Coronado Ave
- 0 Magellan Ave Unit ML82015782
- 121 Magellan Ave
- 1 Le Havre Place
- 139 Santa Anna St
- 422 Santa Maria Ave
- 1568 Mizzen Ln
- 1163 Columbus St
- 1527 Hawser Ln
- 1557 Mizzen Ln
- 586 Avenue Alhambra
- 150 Valencia St
- 87 Valencia St
- 96 Valencia St
- 85 Valencia St
- 90 Valencia St
- 200 Valencia St
- 83 Valencia St
- 84 Valencia St
- 77 Valencia St
- 78 Valencia St
- 95 Ventura St
- 89 Ventura St
- 71 Valencia St
- 72 Valencia St
- 83 Ventura St
- 77 Ventura St
- 61a Valencia St Unit A
- 61a Valencia St
- 2914 Court of San Marco
- 65 Valencia St