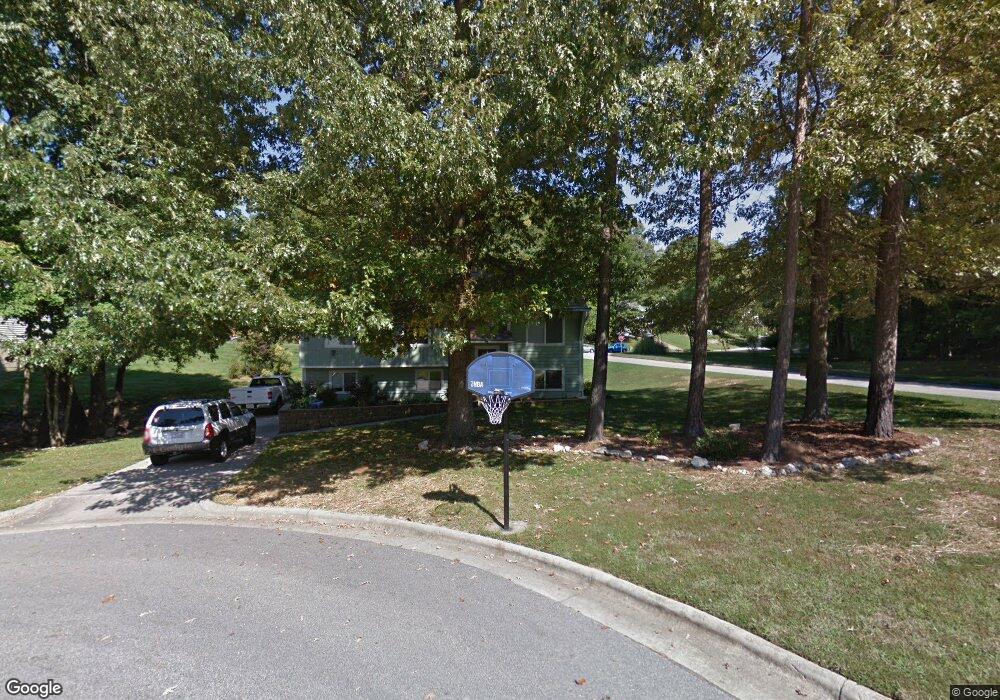
100 W Charing Cross Cary, NC 27513
North Cary NeighborhoodEstimated Value: $461,000 - $502,000
4
Beds
3
Baths
2,290
Sq Ft
$209/Sq Ft
Est. Value
About This Home
This home is located at 100 W Charing Cross, Cary, NC 27513 and is currently estimated at $478,810, approximately $209 per square foot. 100 W Charing Cross is a home located in Wake County with nearby schools including Reedy Creek Elementary School, Reedy Creek Magnet Middle School, and Cary High School.
Ownership History
Date
Name
Owned For
Owner Type
Purchase Details
Closed on
Jun 16, 2016
Sold by
Carpenter Robert Collins and Carpenter Shannon Smith
Bought by
Mchugh John T
Current Estimated Value
Home Financials for this Owner
Home Financials are based on the most recent Mortgage that was taken out on this home.
Original Mortgage
$196,000
Outstanding Balance
$156,197
Interest Rate
3.61%
Mortgage Type
New Conventional
Estimated Equity
$322,613
Purchase Details
Closed on
Jul 2, 2013
Sold by
Mcclenny Eric C and Mcclenny Teresa G
Bought by
Carpenter Robert Collins
Home Financials for this Owner
Home Financials are based on the most recent Mortgage that was taken out on this home.
Original Mortgage
$198,341
Interest Rate
4.5%
Mortgage Type
FHA
Purchase Details
Closed on
Mar 11, 2008
Sold by
Mehta Kirtikumar and Mehta Jyoti K
Bought by
Mcclenny Eric S and Mcclenny Teresa G
Home Financials for this Owner
Home Financials are based on the most recent Mortgage that was taken out on this home.
Original Mortgage
$195,000
Interest Rate
4.75%
Mortgage Type
Purchase Money Mortgage
Create a Home Valuation Report for This Property
The Home Valuation Report is an in-depth analysis detailing your home's value as well as a comparison with similar homes in the area
Home Values in the Area
Average Home Value in this Area
Purchase History
| Date | Buyer | Sale Price | Title Company |
|---|---|---|---|
| Mchugh John T | $245,000 | None Available | |
| Carpenter Robert Collins | $202,000 | None Available | |
| Mcclenny Eric S | $195,000 | None Available |
Source: Public Records
Mortgage History
| Date | Status | Borrower | Loan Amount |
|---|---|---|---|
| Open | Mchugh John T | $196,000 | |
| Previous Owner | Carpenter Robert Collins | $198,341 | |
| Previous Owner | Carpenter Robert Collins | $5,950 | |
| Previous Owner | Mcclenny Eric S | $195,000 |
Source: Public Records
Tax History Compared to Growth
Tax History
| Year | Tax Paid | Tax Assessment Tax Assessment Total Assessment is a certain percentage of the fair market value that is determined by local assessors to be the total taxable value of land and additions on the property. | Land | Improvement |
|---|---|---|---|---|
| 2025 | $3,390 | $393,140 | $185,000 | $208,140 |
| 2024 | $3,316 | $393,140 | $185,000 | $208,140 |
| 2023 | $2,720 | $269,438 | $125,000 | $144,438 |
| 2022 | $2,619 | $269,438 | $125,000 | $144,438 |
| 2021 | $2,566 | $269,438 | $125,000 | $144,438 |
| 2020 | $2,580 | $269,438 | $125,000 | $144,438 |
| 2019 | $2,300 | $212,963 | $78,000 | $134,963 |
| 2018 | $2,159 | $212,963 | $78,000 | $134,963 |
| 2017 | $2,075 | $212,963 | $78,000 | $134,963 |
| 2016 | $2,044 | $212,963 | $78,000 | $134,963 |
| 2015 | $1,797 | $180,535 | $56,000 | $124,535 |
| 2014 | $1,695 | $180,535 | $56,000 | $124,535 |
Source: Public Records
Map
Nearby Homes
- 917 Reedy Creek Rd
- 309 Wyatts Pond Ln
- 1399 N Harrison Ave
- 201 W Wyatts Pond Ln
- 100 Joppa Ct
- 102 Choptank Ct Unit B5
- 501 Gooseneck Dr Unit B6
- 501 Gooseneck Dr Unit B2
- 503 Gooseneck Dr Unit B2
- 411 Gooseneck Dr Unit A1
- 405 Gooseneck Dr Unit B2
- 405 Gooseneck Dr Unit B6
- 0 Reedy Creek Rd
- 108 N Woodshed Ct
- 200 Dublin Woods Dr
- 107 Canyon Run
- 111 Killam Ct Unit 2A
- 118 Grande Meadow Way
- 113 Montibello Dr
- 135 Boldleaf Ct
- 114 Wyatts Pond Ln
- 101 E Charing Cross
- 112 Wyatts Pond Ln
- 100 Bristol Hill Ct
- 102 W Charing Cross
- 101 W Charing Cross
- 201 Wyatts Pond Ln
- 100 Cathedral Way
- 103 W Charing Cross
- 102 Bristol Hill Ct
- 110 Wyatts Pond Ln
- 101 Cathedral Way
- 203 Wyatts Pond Ln
- 103 E Charing Cross
- 100 E Charing Cross
- 107 Houndschase Run
- 107 Houndchase Run
- 102 Cathedral Way
- 108 Wyatts Pond Ln
- 104 Bristol Hill Ct