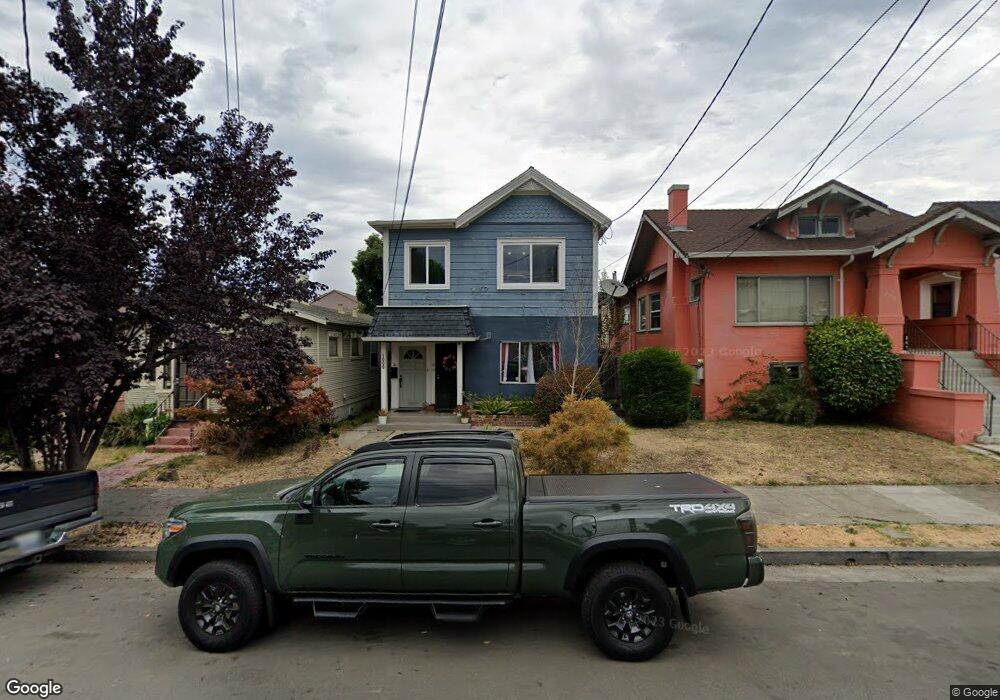
1000 39th St Emeryville, CA 94608
Longfellow NeighborhoodEstimated Value: $801,000 - $1,034,357
4
Beds
2
Baths
1,932
Sq Ft
$463/Sq Ft
Est. Value
About This Home
This home is located at 1000 39th St, Emeryville, CA 94608 and is currently estimated at $894,839, approximately $463 per square foot. 1000 39th St is a home located in Alameda County with nearby schools including Emerson Elementary School, Westlake Middle School, and McClymonds High School.
Ownership History
Date
Name
Owned For
Owner Type
Purchase Details
Closed on
Oct 21, 2016
Sold by
Glodde Amy Beth and Baker Douglas E
Bought by
Gadonniex Heather L and Hoskins Gwynn D
Current Estimated Value
Home Financials for this Owner
Home Financials are based on the most recent Mortgage that was taken out on this home.
Original Mortgage
$585,000
Outstanding Balance
$469,581
Interest Rate
3.5%
Mortgage Type
New Conventional
Estimated Equity
$425,258
Purchase Details
Closed on
Mar 12, 2014
Sold by
Glodde Amy Beth and Baker Doug E
Bought by
Glodde Amy Beth and Baker Douglas E
Purchase Details
Closed on
Mar 8, 2010
Sold by
Kiel Wilbur Dean and Kiel Michael A
Bought by
Glodde Amy Beth and Baker Doug E
Home Financials for this Owner
Home Financials are based on the most recent Mortgage that was taken out on this home.
Original Mortgage
$341,792
Interest Rate
4.87%
Mortgage Type
FHA
Purchase Details
Closed on
Dec 22, 2009
Sold by
Kiel Wilbur Dean and The Velma Kiel Revocable Inter
Bought by
Kiel Wilbur Dean and Kiel Michael A
Create a Home Valuation Report for This Property
The Home Valuation Report is an in-depth analysis detailing your home's value as well as a comparison with similar homes in the area
Home Values in the Area
Average Home Value in this Area
Purchase History
| Date | Buyer | Sale Price | Title Company |
|---|---|---|---|
| Gadonniex Heather L | $650,000 | Chicago Title Company | |
| Glodde Amy Beth | -- | North American Title Co Inc | |
| Glodde Amy Beth | $348,500 | Old Republic Title Company | |
| Kiel Wilbur Dean | -- | None Available |
Source: Public Records
Mortgage History
| Date | Status | Borrower | Loan Amount |
|---|---|---|---|
| Open | Gadonniex Heather L | $585,000 | |
| Previous Owner | Glodde Amy Beth | $341,792 |
Source: Public Records
Tax History Compared to Growth
Tax History
| Year | Tax Paid | Tax Assessment Tax Assessment Total Assessment is a certain percentage of the fair market value that is determined by local assessors to be the total taxable value of land and additions on the property. | Land | Improvement |
|---|---|---|---|---|
| 2025 | $11,689 | $754,363 | $226,309 | $528,054 |
| 2024 | $11,689 | $739,575 | $221,872 | $517,703 |
| 2023 | $12,248 | $725,074 | $217,522 | $507,552 |
| 2022 | $11,869 | $710,858 | $213,257 | $497,601 |
| 2021 | $11,313 | $696,923 | $209,077 | $487,846 |
| 2020 | $11,188 | $689,780 | $206,934 | $482,846 |
| 2019 | $10,745 | $676,260 | $202,878 | $473,382 |
| 2018 | $10,522 | $663,000 | $198,900 | $464,100 |
| 2017 | $10,109 | $650,000 | $195,000 | $455,000 |
| 2016 | $6,320 | $379,451 | $113,835 | $265,616 |
| 2015 | $6,285 | $373,754 | $112,126 | $261,628 |
| 2014 | $6,413 | $366,436 | $109,931 | $256,505 |
Source: Public Records
Map
Nearby Homes
- 3960 Adeline St Unit 107
- 3960 Adeline St Unit 303
- 985 41st St Unit 140
- 1007 41st St Unit 334
- 1121 40th St Unit 3103
- 1121 40th St Unit 4105
- 1121 40th St Unit 2406
- 1121 40th St Unit 4201
- 1121 40th St Unit 3307
- 933 41st St
- 906 40th St
- 3801 San Pablo Ave Unit 312
- 942 41st St
- 4240 Adeline St
- 863 40th St
- 915 37th St
- 835 Apgar St
- 4320 Adeline St
- 3906 Lusk St
- 3508 Adeline St
- 1004 39th St
- 990 39th St
- 1008 39th St
- 984 39th St
- 1015 Yerba Buena Ave
- 1011 Yerba Buena Ave
- 978 39th St
- 1025 Yerba Buena Ave
- 1007 Yerba Buena Ave
- 974 39th St
- 1029 Yerba Buena Ave
- 1001 Yerba Buena Ave
- 993 39th St
- 991 39th St
- 1007 39th St
- 970 39th St
- 985 39th St
- 1028 39th St
- 987 Yerba Buena Ave
- 983 39th St