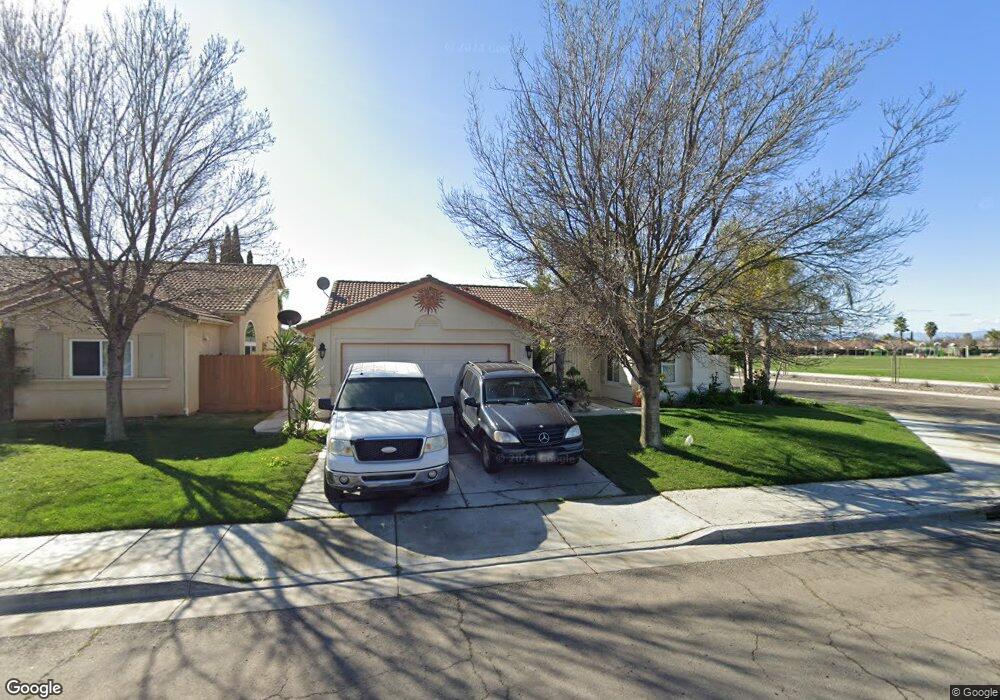
1000 Chenin Blanc St Los Banos, CA 93635
Estimated Value: $381,000 - $430,000
3
Beds
2
Baths
1,379
Sq Ft
$299/Sq Ft
Est. Value
About This Home
This home is located at 1000 Chenin Blanc St, Los Banos, CA 93635 and is currently estimated at $411,819, approximately $298 per square foot. 1000 Chenin Blanc St is a home located in Merced County with nearby schools including Lorena Falasco Elementary School, Los Banos Junior High School, and Pacheco High School.
Ownership History
Date
Name
Owned For
Owner Type
Purchase Details
Closed on
Jan 25, 2010
Sold by
Kelly Kevin B and Kelly Carmen M
Bought by
Ramirez Rosaelia V
Current Estimated Value
Purchase Details
Closed on
Jan 22, 2010
Sold by
Ramirez Conrado F
Bought by
Ramirez Rosaelia V
Purchase Details
Closed on
Apr 18, 2006
Sold by
Mercado Joanne and Ramirez Norma J
Bought by
Kelly Kevin B and Kelly Carmen M
Purchase Details
Closed on
Nov 17, 2004
Sold by
Vineyards 12 & 13 Llc
Bought by
Mercado Joanne and Ramirez Norma J
Home Financials for this Owner
Home Financials are based on the most recent Mortgage that was taken out on this home.
Original Mortgage
$235,397
Interest Rate
5.64%
Mortgage Type
Purchase Money Mortgage
Create a Home Valuation Report for This Property
The Home Valuation Report is an in-depth analysis detailing your home's value as well as a comparison with similar homes in the area
Home Values in the Area
Average Home Value in this Area
Purchase History
| Date | Buyer | Sale Price | Title Company |
|---|---|---|---|
| Ramirez Rosaelia V | $115,000 | Transcounty Title Company | |
| Ramirez Rosaelia V | -- | Transcounty Title Company | |
| Kelly Kevin B | $382,000 | Alliance Title Company | |
| Mercado Joanne | $292,500 | Fidelity National Title Comp |
Source: Public Records
Mortgage History
| Date | Status | Borrower | Loan Amount |
|---|---|---|---|
| Previous Owner | Mercado Joanne | $235,397 | |
| Closed | Mercado Joanne | $58,849 |
Source: Public Records
Tax History Compared to Growth
Tax History
| Year | Tax Paid | Tax Assessment Tax Assessment Total Assessment is a certain percentage of the fair market value that is determined by local assessors to be the total taxable value of land and additions on the property. | Land | Improvement |
|---|---|---|---|---|
| 2025 | $2,540 | $148,429 | $12,901 | $135,528 |
| 2024 | $2,540 | $145,520 | $12,649 | $132,871 |
| 2023 | $2,398 | $142,667 | $12,401 | $130,266 |
| 2022 | $2,321 | $139,870 | $12,158 | $127,712 |
| 2021 | $2,252 | $137,128 | $11,920 | $125,208 |
| 2020 | $2,211 | $135,723 | $11,798 | $123,925 |
| 2019 | $2,158 | $133,063 | $11,567 | $121,496 |
| 2018 | $2,088 | $130,455 | $11,341 | $119,114 |
| 2017 | $2,025 | $127,898 | $11,119 | $116,779 |
| 2016 | $2,022 | $125,391 | $10,901 | $114,490 |
| 2015 | $1,984 | $123,509 | $10,738 | $112,771 |
| 2014 | $1,907 | $121,090 | $10,528 | $110,562 |
Source: Public Records
Map
Nearby Homes
- 1013 Chenin Blanc St
- 644 Mendocino Ct
- 675 Pinot Noir Ct
- 1007 Acaciawood Ct
- 1024 Walnutwood Ct
- 543 N Mercey Springs Rd
- 255 Birchwood Ave
- 947 Burlwood Ct
- 1338 Quail St
- 1347 Dove St
- 1349 Quail St
- 475 Santa Barbara St
- 1364 Dove St
- 1406 Quail St
- 766 Meadowlark Ave
- 405 N Santa Ana St
- 831 Mesa Ct
- 436 N Mercey Springs Rd Unit 69
- 436 N Mercey Springs Rd Unit 16
- 316 Rosalie Ct
- 1004 Chenin Blanc St
- 714 Stonewood Dr
- 1008 Chenin Blanc St
- 710 Stonewood Dr
- 715 Polcetto Ct
- 1001 Chenin Blanc St
- 1005 Chenin Blanc St
- 711 Polcetto Ct
- 706 Stonewood Dr
- 1009 Chenin Blanc St
- 707 Polcetto Ct
- 1011 Chenin Blanc St
- 702 Stonewood Dr
- 724 Polcetto Ct
- 720 Polcetto Ct
- 716 Polcetto Ct
- 703 Polcetto Ct
- 712 Polcetto Ct
- 1017 Chenin Blanc St
- 708 Polcetto Ct