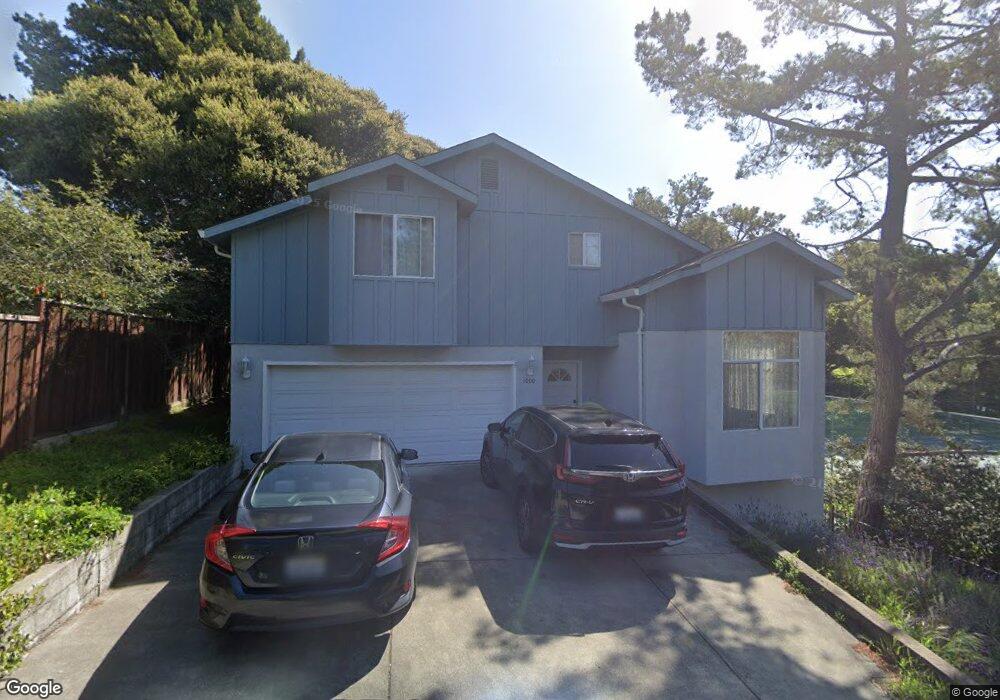
1000 Cresent Way El Cerrito, CA 94530
Estimated Value: $1,061,000 - $1,455,000
3
Beds
3
Baths
2,234
Sq Ft
$580/Sq Ft
Est. Value
About This Home
This home is located at 1000 Cresent Way, El Cerrito, CA 94530 and is currently estimated at $1,296,015, approximately $580 per square foot. 1000 Cresent Way is a home located in Contra Costa County with nearby schools including Madera Elementary School, Fred T. Korematsu Middle School, and El Cerrito Senior High School.
Ownership History
Date
Name
Owned For
Owner Type
Purchase Details
Closed on
Jul 27, 2009
Sold by
Russell Ryan and Russell Sara J
Bought by
Russell Ryan and Russell Sara J
Current Estimated Value
Purchase Details
Closed on
May 13, 1998
Sold by
Connors M V
Bought by
Russell Ryan and Russell Sara J
Home Financials for this Owner
Home Financials are based on the most recent Mortgage that was taken out on this home.
Original Mortgage
$253,650
Outstanding Balance
$49,691
Interest Rate
7.13%
Mortgage Type
Purchase Money Mortgage
Estimated Equity
$1,246,324
Purchase Details
Closed on
Aug 10, 1997
Sold by
Connors Judith M
Bought by
Connors M
Home Financials for this Owner
Home Financials are based on the most recent Mortgage that was taken out on this home.
Original Mortgage
$27,500
Interest Rate
7.45%
Mortgage Type
Purchase Money Mortgage
Create a Home Valuation Report for This Property
The Home Valuation Report is an in-depth analysis detailing your home's value as well as a comparison with similar homes in the area
Home Values in the Area
Average Home Value in this Area
Purchase History
| Date | Buyer | Sale Price | Title Company |
|---|---|---|---|
| Russell Ryan | -- | Chicago Title Company | |
| Russell Ryan | $317,500 | Old Republic Title Company | |
| Connors M | -- | Old Republic Title Company | |
| Connors M | $55,000 | Old Republic Title Company |
Source: Public Records
Mortgage History
| Date | Status | Borrower | Loan Amount |
|---|---|---|---|
| Open | Russell Ryan | $253,650 | |
| Previous Owner | Connors M | $27,500 |
Source: Public Records
Tax History Compared to Growth
Tax History
| Year | Tax Paid | Tax Assessment Tax Assessment Total Assessment is a certain percentage of the fair market value that is determined by local assessors to be the total taxable value of land and additions on the property. | Land | Improvement |
|---|---|---|---|---|
| 2025 | $7,779 | $523,022 | $175,629 | $347,393 |
| 2024 | $7,637 | $512,768 | $172,186 | $340,582 |
| 2023 | $7,637 | $502,714 | $168,810 | $333,904 |
| 2022 | $7,508 | $492,857 | $165,500 | $327,357 |
| 2021 | $7,462 | $483,194 | $162,255 | $320,939 |
| 2019 | $6,998 | $468,865 | $157,444 | $311,421 |
| 2018 | $6,568 | $444,966 | $154,357 | $290,609 |
| 2017 | $6,466 | $436,242 | $151,331 | $284,911 |
| 2016 | $6,439 | $427,689 | $148,364 | $279,325 |
| 2015 | -- | $421,266 | $146,136 | $275,130 |
| 2014 | $6,347 | $413,015 | $143,274 | $269,741 |
Source: Public Records
Map
Nearby Homes
- 2028 Mira Vista Dr
- 2034 Carquinez Ave
- 2400 Mira Vista Dr
- 6919 Wilson Way
- 2063 Tapscott Ave
- 6445 Hagen Blvd
- 2530 Edwards Ave
- 2030 Junction Ave
- 2022 Junction Ave
- 2502 Yuba St
- 2021 Key Blvd
- 5212 Macdonald Ave
- 2634 Arlington Blvd
- 6620 Hill St
- 2711 Tulare Ave
- 5120 Prather Ave
- 6524 Alta Vista Dr
- 1909 Francisco Way
- 7231 Plank Ave
- 6006 Jordan Ave
- 6010 Jordan Ave
- 2239 Mira Vista Dr
- 2243 Mira Vista Dr
- 6018 Jordan Ave
- 2035 Mira Vista Dr
- 5936 Jordan Ave
- 2031 Mira Vista Dr
- 2251 Mira Vista Dr
- 5934 Jordan Ave
- 2027 Mira Vista Dr
- 6009 Jordan Ave
- 6015 Jordan Ave
- 6001 Jordan Ave
- 5932 Jordan Ave
- 2244 Mira Vista Dr
- 2240 Mira Vista Dr
- 2248 Mira Vista Dr
- 2036 Mira Vista Dr
- 5930 Jordan Ave