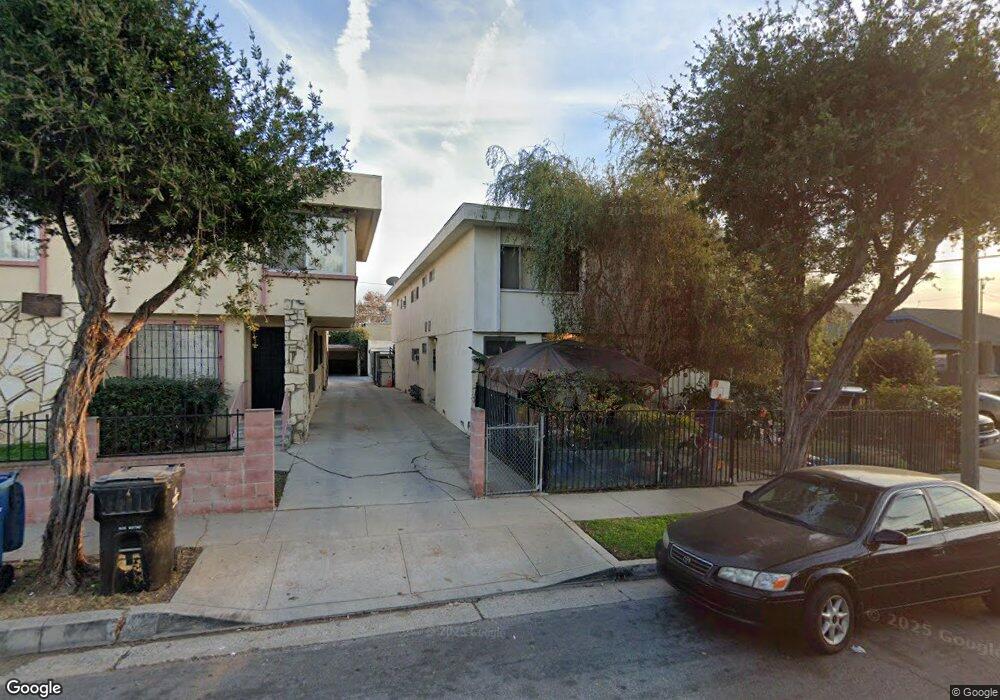
1000 E Brett St Inglewood, CA 90302
North Inglewood NeighborhoodEstimated Value: $974,000 - $1,278,000
6
Beds
4
Baths
3,684
Sq Ft
$309/Sq Ft
Est. Value
About This Home
This home is located at 1000 E Brett St, Inglewood, CA 90302 and is currently estimated at $1,137,262, approximately $308 per square foot. 1000 E Brett St is a home located in Los Angeles County with nearby schools including Centinela Elementary School, Crozier (George W.) Middle School, and Inglewood High School.
Ownership History
Date
Name
Owned For
Owner Type
Purchase Details
Closed on
Jan 13, 2020
Sold by
Nwosu Stanley
Bought by
Nwosu Henry
Current Estimated Value
Home Financials for this Owner
Home Financials are based on the most recent Mortgage that was taken out on this home.
Original Mortgage
$740,000
Outstanding Balance
$653,819
Interest Rate
3.6%
Mortgage Type
New Conventional
Estimated Equity
$483,443
Purchase Details
Closed on
Aug 22, 2019
Sold by
Obianuju Onwuneme
Bought by
Nwosu Stanley
Purchase Details
Closed on
Jul 8, 2019
Sold by
Nwosu Amarachi
Bought by
Nwosu Henry
Purchase Details
Closed on
Oct 27, 2017
Sold by
Nwosu Stanley
Bought by
Nwosu Stanley and Nwosu Henry
Purchase Details
Closed on
Jul 10, 2001
Sold by
Grant Floyd
Bought by
Nwosu Stanley
Home Financials for this Owner
Home Financials are based on the most recent Mortgage that was taken out on this home.
Original Mortgage
$305,682
Interest Rate
7.09%
Mortgage Type
FHA
Create a Home Valuation Report for This Property
The Home Valuation Report is an in-depth analysis detailing your home's value as well as a comparison with similar homes in the area
Home Values in the Area
Average Home Value in this Area
Purchase History
| Date | Buyer | Sale Price | Title Company |
|---|---|---|---|
| Nwosu Henry | -- | Lawyers Title | |
| Nwosu Stanley | -- | Lawyers Title | |
| Nwosu Henry | -- | Lawyers Title | |
| Nwosu Stanley | -- | None Available | |
| Nwosu Stanley | $310,000 | First American Title Co |
Source: Public Records
Mortgage History
| Date | Status | Borrower | Loan Amount |
|---|---|---|---|
| Open | Nwosu Henry | $740,000 | |
| Previous Owner | Nwosu Stanley | $305,682 |
Source: Public Records
Tax History
| Year | Tax Paid | Tax Assessment Tax Assessment Total Assessment is a certain percentage of the fair market value that is determined by local assessors to be the total taxable value of land and additions on the property. | Land | Improvement |
|---|---|---|---|---|
| 2025 | $10,710 | $797,872 | $553,343 | $244,529 |
| 2024 | $10,710 | $782,229 | $542,494 | $239,735 |
| 2023 | $10,599 | $766,892 | $531,857 | $235,035 |
| 2022 | $10,790 | $751,856 | $521,429 | $230,427 |
| 2021 | $10,689 | $737,114 | $511,205 | $225,909 |
| 2020 | $10,221 | $729,557 | $505,964 | $223,593 |
| 2019 | $10,054 | $715,253 | $496,044 | $219,209 |
| 2018 | $9,990 | $701,229 | $486,318 | $214,911 |
| 2017 | $5,924 | $394,586 | $267,302 | $127,284 |
| 2016 | $5,753 | $386,850 | $262,061 | $124,789 |
| 2015 | $5,699 | $381,040 | $258,125 | $122,915 |
| 2014 | $5,706 | $373,577 | $253,069 | $120,508 |
Source: Public Records
Map
Nearby Homes
- 1008 Long St
- 1108 E Fairview Blvd
- 1109 N Chester Ave
- 6318 Eileen Ave
- 924 N Chester Ave
- 6325 Long St
- 6303 Eileen Ave
- 958 E 67th St
- 6210 S Rimpau Blvd
- 1144 E 65th St
- 1139 E 67th St
- 6312 S Verdun Ave
- 1118 Marlborough Ave
- 1142 E 66th St
- 6605 West Blvd
- 6411 West Blvd
- 4124 W 64th St
- 642 E Fairview Blvd
- 916 E 68th St
- 6030 Alviso Ave
- 1000 E Brett St Unit 1
- 1004 E Brett St
- 1006 E Brett St
- 960 E Brett St
- 1108 Gay St
- 1010 E Brett St
- 958 E Brett St
- 1109 Gay St
- 1007 E Hyde Park Blvd
- 1014 E Brett St
- 954 E Brett St
- 1001 E Brett St
- 1009 E Brett St
- 1016 E Brett St
- 1015 E Hyde Park Blvd
- 963 E Brett St
- 952 E Brett St
- 1011 E Brett St
- 955 E Hyde Park Blvd
- 959 E Brett St
Your Personal Tour Guide
Ask me questions while you tour the home.