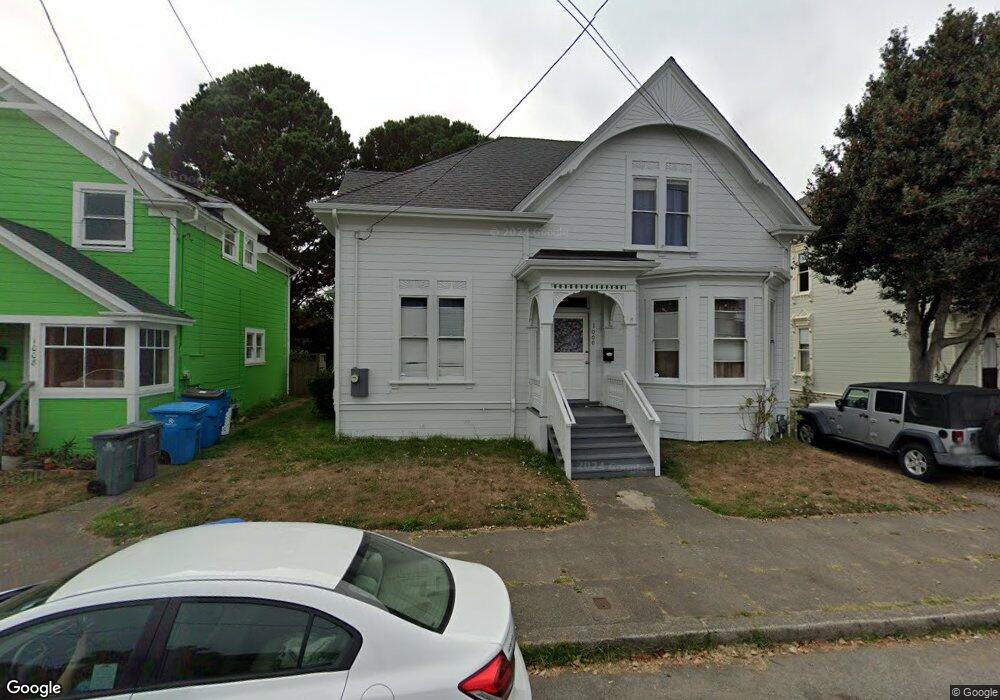
1000 G St Eureka, CA 95501
Broadway Street NeighborhoodEstimated Value: $329,000 - $969,000
Studio
--
Bath
--
Sq Ft
9,322
Sq Ft Lot
About This Home
This home is located at 1000 G St, Eureka, CA 95501 and is currently estimated at $494,692. 1000 G St is a home located in Humboldt County with nearby schools including Lafayette Elementary School, Catherine L. Zane Middle School, and Eureka Senior High School.
Ownership History
Date
Name
Owned For
Owner Type
Purchase Details
Closed on
Jan 24, 2024
Sold by
Squires Rodney Mark and Squires Anna Renee
Bought by
Rodney Mark And Anna Renee Squires 2023 Revoc and Squires
Current Estimated Value
Purchase Details
Closed on
Aug 15, 2006
Sold by
Squires Rodney Mark and Squires Anna Renee
Bought by
Squires Rodney Mark and Squires Anna Renee
Home Financials for this Owner
Home Financials are based on the most recent Mortgage that was taken out on this home.
Original Mortgage
$200,000
Interest Rate
6.7%
Mortgage Type
New Conventional
Purchase Details
Closed on
Sep 24, 2003
Sold by
Partone Charles Ray
Bought by
Partone Charles and Charles Partone Living Trust
Purchase Details
Closed on
Oct 19, 1998
Sold by
Squires Floyd E
Bought by
Squires Ruth E
Create a Home Valuation Report for This Property
The Home Valuation Report is an in-depth analysis detailing your home's value as well as a comparison with similar homes in the area
Home Values in the Area
Average Home Value in this Area
Purchase History
| Date | Buyer | Sale Price | Title Company |
|---|---|---|---|
| Rodney Mark And Anna Renee Squires 2023 Revoc | -- | None Listed On Document | |
| Squires Rodney Mark | -- | Humboldt Land Title Company | |
| Squires Rodney M | $49,000 | Humboldt Land Title Company | |
| Partone Charles | -- | -- | |
| Squires Ruth E | -- | -- |
Source: Public Records
Mortgage History
| Date | Status | Borrower | Loan Amount |
|---|---|---|---|
| Previous Owner | Squires Rodney Mark | $200,000 |
Source: Public Records
Tax History
| Year | Tax Paid | Tax Assessment Tax Assessment Total Assessment is a certain percentage of the fair market value that is determined by local assessors to be the total taxable value of land and additions on the property. | Land | Improvement |
|---|---|---|---|---|
| 2025 | $1,396 | $135,695 | $71,841 | $63,854 |
| 2024 | $1,396 | $133,035 | $70,433 | $62,602 |
| 2023 | $1,376 | $130,427 | $69,052 | $61,375 |
| 2022 | $1,428 | $127,871 | $67,699 | $60,172 |
| 2021 | $1,338 | $125,365 | $66,372 | $58,993 |
| 2020 | $1,328 | $124,081 | $65,692 | $58,389 |
| 2019 | $1,300 | $121,649 | $64,404 | $57,245 |
| 2018 | $1,281 | $119,265 | $63,142 | $56,123 |
| 2017 | $1,274 | $116,927 | $61,904 | $55,023 |
| 2016 | $1,275 | $114,636 | $60,691 | $53,945 |
| 2015 | $1,264 | $112,915 | $59,780 | $53,135 |
| 2014 | $1,181 | $110,704 | $58,609 | $52,095 |
Source: Public Records
Map
Nearby Homes
Your Personal Tour Guide
Ask me questions while you tour the home.