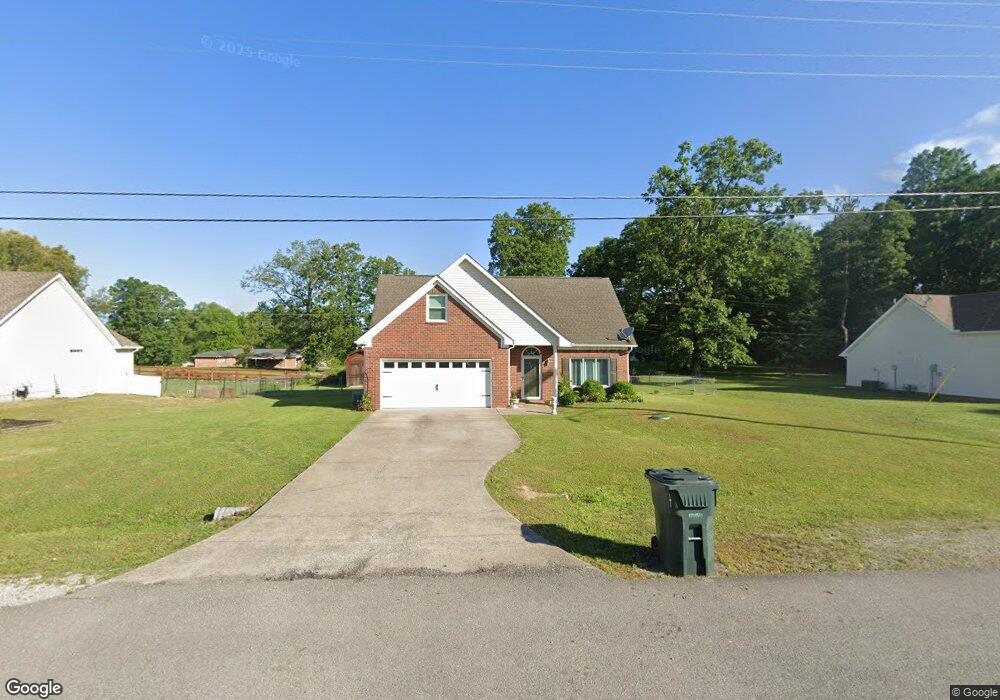
1000 Hickory Pointe Run Dickson, TN 37055
Estimated Value: $315,373 - $396,000
3
Beds
3
Baths
2,277
Sq Ft
$159/Sq Ft
Est. Value
About This Home
This home is located at 1000 Hickory Pointe Run, Dickson, TN 37055 and is currently estimated at $363,093, approximately $159 per square foot. 1000 Hickory Pointe Run is a home located in Dickson County with nearby schools including Centennial Elementary School, Dickson Middle School, and Dickson County High School.
Ownership History
Date
Name
Owned For
Owner Type
Purchase Details
Closed on
Oct 9, 2020
Sold by
Ramey Lavonta T
Bought by
Ramey Lavonta T and Ramey Victoria Hope
Current Estimated Value
Home Financials for this Owner
Home Financials are based on the most recent Mortgage that was taken out on this home.
Original Mortgage
$134,292
Outstanding Balance
$108,102
Interest Rate
2.9%
Mortgage Type
New Conventional
Estimated Equity
$254,991
Purchase Details
Closed on
Nov 16, 2018
Sold by
Ramey Lavonta T
Bought by
Ramey Lavonta T
Purchase Details
Closed on
Jul 26, 2004
Sold by
Dial David
Bought by
Ramey Lavonta T
Home Financials for this Owner
Home Financials are based on the most recent Mortgage that was taken out on this home.
Original Mortgage
$132,812
Interest Rate
6.13%
Purchase Details
Closed on
Aug 29, 2003
Bought by
Ramey Lavonta T and Ramey Marsha
Purchase Details
Closed on
Jun 18, 2003
Sold by
Eatherly Properties
Bought by
Dial Properties Llc
Create a Home Valuation Report for This Property
The Home Valuation Report is an in-depth analysis detailing your home's value as well as a comparison with similar homes in the area
Home Values in the Area
Average Home Value in this Area
Purchase History
| Date | Buyer | Sale Price | Title Company |
|---|---|---|---|
| Ramey Lavonta T | -- | None Available | |
| Ramey Lavonta T | -- | -- | |
| Ramey Lavonta T | $133,900 | -- | |
| Ramey Lavonta T | $133,900 | -- | |
| Dial Properties Llc | $19,000 | -- |
Source: Public Records
Mortgage History
| Date | Status | Borrower | Loan Amount |
|---|---|---|---|
| Open | Ramey Lavonta T | $134,292 | |
| Previous Owner | Dial Properties Llc | $132,812 |
Source: Public Records
Tax History Compared to Growth
Tax History
| Year | Tax Paid | Tax Assessment Tax Assessment Total Assessment is a certain percentage of the fair market value that is determined by local assessors to be the total taxable value of land and additions on the property. | Land | Improvement |
|---|---|---|---|---|
| 2024 | $1,692 | $74,300 | $11,250 | $63,050 |
| 2023 | $1,692 | $54,150 | $8,000 | $46,150 |
| 2022 | $1,692 | $54,150 | $8,000 | $46,150 |
| 2021 | $1,685 | $54,150 | $8,000 | $46,150 |
| 2020 | $1,685 | $53,950 | $8,000 | $45,950 |
| 2019 | $1,685 | $53,950 | $8,000 | $45,950 |
| 2018 | $1,608 | $44,075 | $5,000 | $39,075 |
| 2017 | $1,608 | $44,075 | $5,000 | $39,075 |
| 2016 | $1,608 | $44,075 | $5,000 | $39,075 |
| 2015 | $1,460 | $37,650 | $5,000 | $32,650 |
| 2014 | $1,460 | $37,650 | $5,000 | $32,650 |
Source: Public Records
Map
Nearby Homes
- 906 Highway 48 S
- 2620 Highway 48 S
- 501 Poplar Bend
- 124 W Piney Rd
- 121 Regency Ln
- 146 Sherron Dr
- 153 Baggett Ln
- 127 Sherron Dr
- 105 Tices Spring Ct
- 422 High St
- 433 Center Ave
- 430 Center Ave
- 501 High St Unit A
- 112 Harvest Cir
- 0 Furnace Hollow Rd Unit RTC3001315
- 0 Furnace Hollow Rd Unit RTC3001314
- 0 Furnace Hollow Rd Unit RTC3001313
- 0 Furnace Hollow Rd Unit RTC3001312
- 0 Furnace Hollow Rd Unit RTC3001310
- 0 Furnace Hollow Rd Unit RTC3001307
- 1000 Hickory Pointe
- 1002 Hickory Pointe
- 924 Hickory Pointe
- 100 Hickory Run
- 1004 Hickory Pointe
- 921 Hickory Pointe
- 1003 Hickory Pointe
- 1005 Hickory Pointe
- 1006 Hickory Pointe
- 0 Hickory Run
- 102 Hickory Run
- 907 Highway 48 S
- 519 Poplar Bend
- 905 Highway 48 S
- 0 Eno Rd
- 0 Eno Rd Unit RTC1575814
- 0 Eno Rd Unit RTC2203866
- 0 Eno Rd Unit RTC1967997
- 0 Eno Rd Unit RTC2442114
- 0 Eno Rd Unit RTC2426958