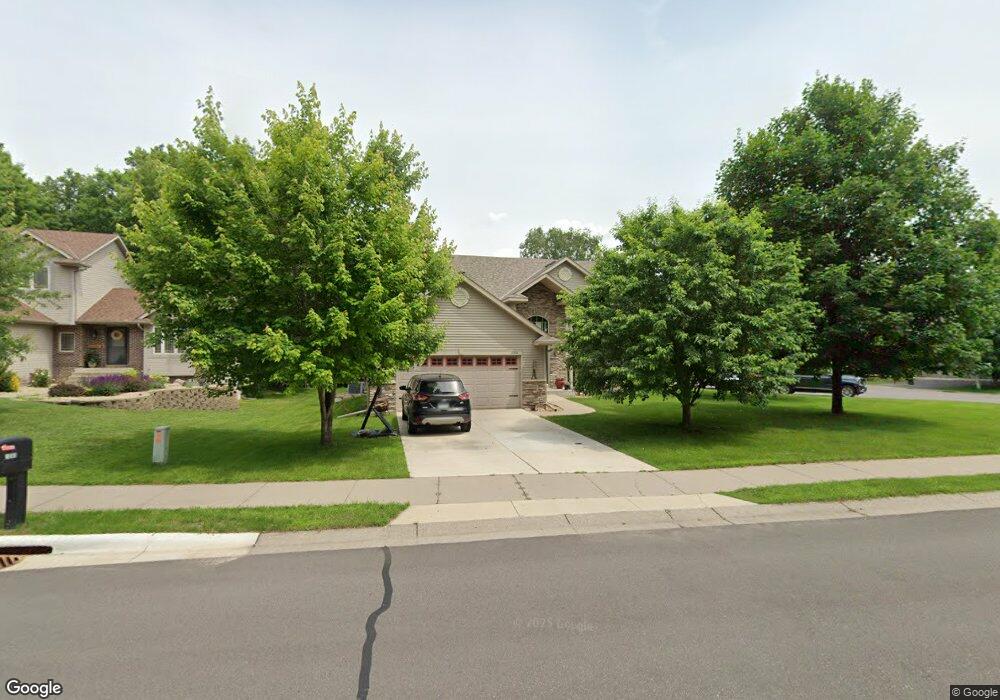
1000 Kensington Way Buffalo, MN 55313
Estimated Value: $382,002 - $398,000
3
Beds
2
Baths
1,390
Sq Ft
$280/Sq Ft
Est. Value
About This Home
This home is located at 1000 Kensington Way, Buffalo, MN 55313 and is currently estimated at $389,001, approximately $279 per square foot. 1000 Kensington Way is a home located in Wright County with nearby schools including Northwinds Elementary School, Buffalo Community Middle School, and Buffalo Senior High School.
Ownership History
Date
Name
Owned For
Owner Type
Purchase Details
Closed on
Jun 6, 2025
Sold by
Anderson John and Dybsetter Jodi Lynn
Bought by
Dybsetter-Anderson Family 2024 Revocable Trus and Dybsetter
Current Estimated Value
Purchase Details
Closed on
Feb 15, 2018
Sold by
Sawbill Outstate Inc
Bought by
Anderson John
Home Financials for this Owner
Home Financials are based on the most recent Mortgage that was taken out on this home.
Original Mortgage
$179,920
Interest Rate
3.95%
Mortgage Type
New Conventional
Purchase Details
Closed on
Oct 2, 2017
Sold by
Eckman Stephanie C and Kitzmann Stephanie C
Bought by
Sawbill Companies Inc
Purchase Details
Closed on
Mar 11, 2005
Sold by
Distinctive Homes & Remodeling Inc
Bought by
Eckman Stephanie
Purchase Details
Closed on
Dec 29, 2003
Sold by
Lyman Development Co
Bought by
Sunset Homes Corp
Purchase Details
Closed on
Nov 5, 2001
Sold by
Builders Development Inc
Bought by
Lyman Development Co
Create a Home Valuation Report for This Property
The Home Valuation Report is an in-depth analysis detailing your home's value as well as a comparison with similar homes in the area
Home Values in the Area
Average Home Value in this Area
Purchase History
| Date | Buyer | Sale Price | Title Company |
|---|---|---|---|
| Dybsetter-Anderson Family 2024 Revocable Trus | $500 | None Listed On Document | |
| Anderson John | $224,900 | Executive Title Tom | |
| Sawbill Companies Inc | -- | None Available | |
| Eckman Stephanie | $225,900 | -- | |
| Sunset Homes Corp | $39,700 | -- | |
| Lyman Development Co | $733,350 | -- |
Source: Public Records
Mortgage History
| Date | Status | Borrower | Loan Amount |
|---|---|---|---|
| Previous Owner | Anderson John | $179,920 |
Source: Public Records
Tax History Compared to Growth
Tax History
| Year | Tax Paid | Tax Assessment Tax Assessment Total Assessment is a certain percentage of the fair market value that is determined by local assessors to be the total taxable value of land and additions on the property. | Land | Improvement |
|---|---|---|---|---|
| 2025 | $4,276 | $363,900 | $75,000 | $288,900 |
| 2024 | $4,164 | $348,000 | $70,000 | $278,000 |
| 2023 | $3,860 | $348,800 | $70,000 | $278,800 |
| 2022 | $3,850 | $303,200 | $64,000 | $239,200 |
| 2021 | $3,624 | $272,200 | $50,000 | $222,200 |
| 2020 | $3,320 | $253,500 | $45,000 | $208,500 |
| 2019 | $2,914 | $227,700 | $0 | $0 |
| 2018 | $2,758 | $196,700 | $0 | $0 |
| 2017 | $2,680 | $185,800 | $0 | $0 |
| 2016 | $2,494 | $0 | $0 | $0 |
| 2015 | $2,358 | $0 | $0 | $0 |
| 2014 | -- | $0 | $0 | $0 |
Source: Public Records
Map
Nearby Homes
- 804 Kensington Way
- 911 Hazelwood Ct
- 924 Golden Pond Ct
- 406 12th St NW
- 1201 Hemlock Cir
- 807 2nd Ave NW
- 1206 Kensington Way
- 403 4th Ave NW
- 1309 Timber Ln
- 1309 Grandview Cir
- TBD Lake Blvd
- 205 3rd St NW
- 1117 Ridgestone Place
- 305 Arcadian Place Unit 1
- xxx 2nd Ave NE
- 110 1st Ave NE Unit 402
- 309 Leksand Ln
- 107 2nd Ave NE
- 605 Highway 55 E
- 604 Sunset St
- 1002 Kensington Way
- 906 Hazelwood Cir
- 904 Hazelwood Cir
- 1004 Kensington Way
- 919 Hazelwood Ct
- 900 Hazelwood Cir
- 1003 Kensington Way
- 902 Hazelwood Cir
- 1005 Kensington Way
- 917 Hazelwood Ct
- 410 11th St NW
- 408 11th St NW
- 412 412 11th-Street-nw
- 913 Hazelwood Ct
- 412 11th St NW
- 901 Hazelwood Ct
- 406 11th St NW
- 414 414 11th-Street-nw
- 414 11th St NW
- 108 Big Woods Ct