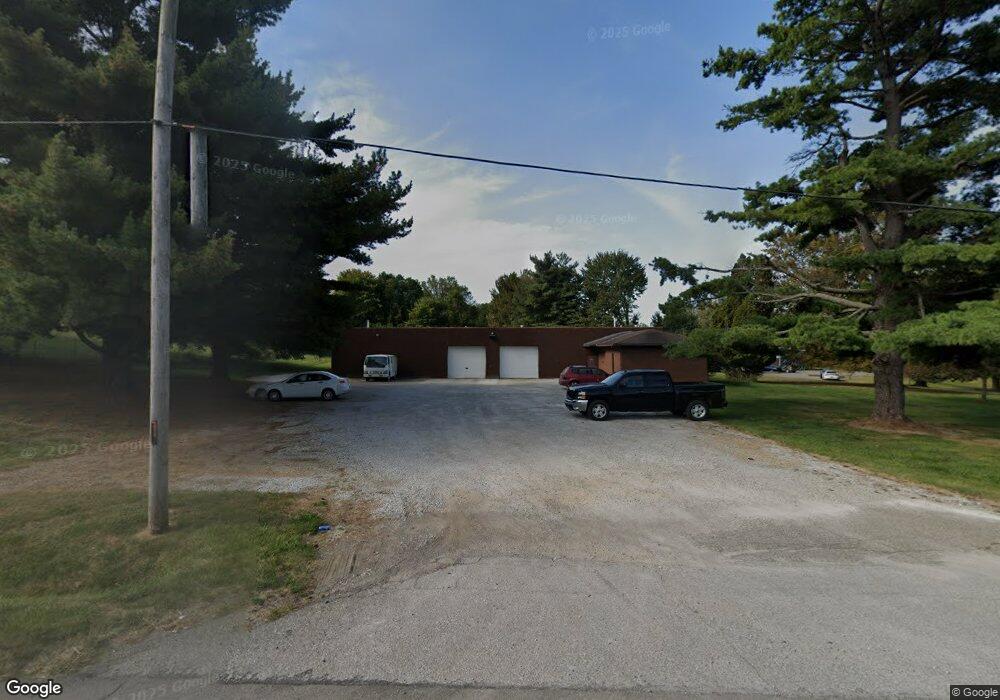
1000 Lucas Rd Mansfield, OH 44905
Estimated Value: $467,552
Studio
--
Bath
8,646
Sq Ft
$54/Sq Ft
Est. Value
About This Home
This home is located at 1000 Lucas Rd, Mansfield, OH 44905 and is currently estimated at $467,552, approximately $54 per square foot. 1000 Lucas Rd is a home located in Richland County with nearby schools including Madison High School, Temple-Christian School, and St. Peter's Elementary/Montessori School.
Ownership History
Date
Name
Owned For
Owner Type
Purchase Details
Closed on
Aug 25, 2017
Sold by
White Robert H
Bought by
Bell John W and Trim Masters Inc
Current Estimated Value
Purchase Details
Closed on
Dec 29, 2011
Sold by
White Robert H
Bought by
Bell John W and Trim Masters Inc
Home Financials for this Owner
Home Financials are based on the most recent Mortgage that was taken out on this home.
Original Mortgage
$197,500
Interest Rate
3.98%
Mortgage Type
Seller Take Back
Create a Home Valuation Report for This Property
The Home Valuation Report is an in-depth analysis detailing your home's value as well as a comparison with similar homes in the area
Home Values in the Area
Average Home Value in this Area
Purchase History
| Date | Buyer | Sale Price | Title Company |
|---|---|---|---|
| Bell John W | $227,500 | None Available | |
| Bell John W | $227,500 | Attorney |
Source: Public Records
Mortgage History
| Date | Status | Borrower | Loan Amount |
|---|---|---|---|
| Previous Owner | Bell John W | $197,500 |
Source: Public Records
Tax History
| Year | Tax Paid | Tax Assessment Tax Assessment Total Assessment is a certain percentage of the fair market value that is determined by local assessors to be the total taxable value of land and additions on the property. | Land | Improvement |
|---|---|---|---|---|
| 2024 | $5,593 | $61,850 | $9,240 | $52,610 |
| 2023 | $5,592 | $61,850 | $9,240 | $52,610 |
| 2022 | $5,912 | $62,700 | $8,400 | $54,300 |
| 2021 | $5,893 | $62,700 | $8,400 | $54,300 |
| 2020 | $5,919 | $62,700 | $8,400 | $54,300 |
| 2019 | $5,356 | $56,470 | $8,400 | $48,070 |
| 2018 | $5,170 | $56,470 | $8,400 | $48,070 |
| 2017 | $5,096 | $56,470 | $8,400 | $48,070 |
| 2016 | $5,088 | $57,170 | $8,400 | $48,770 |
| 2015 | $5,088 | $57,170 | $8,400 | $48,770 |
| 2014 | $5,562 | $57,170 | $8,400 | $48,770 |
| 2012 | $5,361 | $57,170 | $8,400 | $48,770 |
Source: Public Records
Map
Nearby Homes
Your Personal Tour Guide
Ask me questions while you tour the home.