Estimated Value: $518,294 - $540,000
About This Home
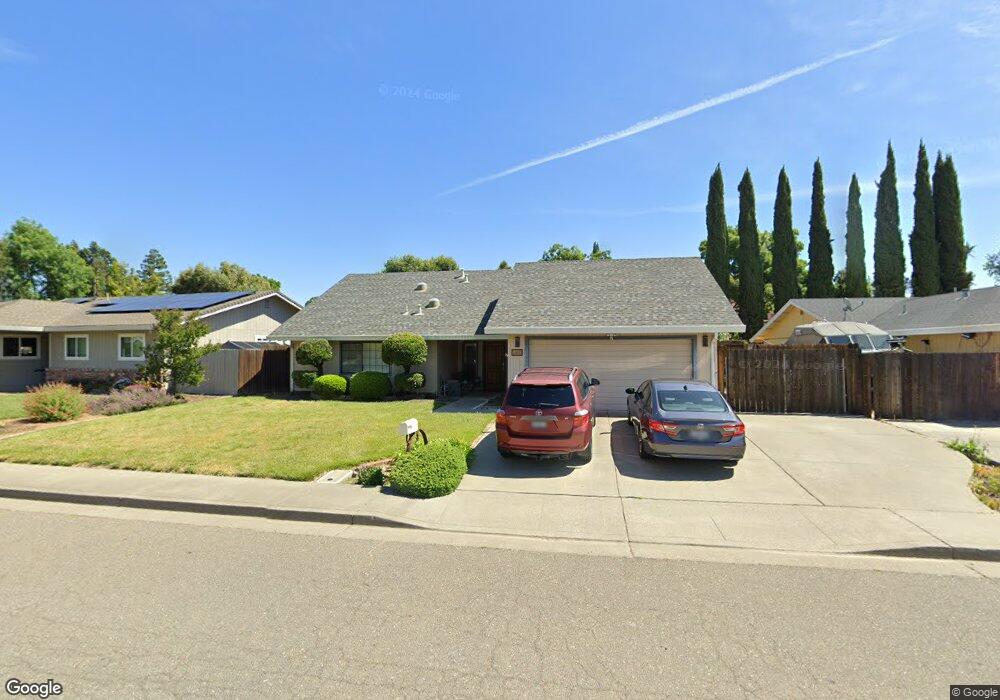
This home is located at 1000 Mason Ct, Dixon, CA 95620 and is currently estimated at $528,574, approximately $378 per square foot. 1000 Mason Ct is a home located in Solano County with nearby schools including Gretchen Higgins Elementary School, Dixon High School, and Dixon Montessori Charter.
Ownership History
We collect this data history from publicly available records. To have your information removed, we recommend requesting removal directly through your county’s website.
Purchase Details
Purchase Details
Home Financials for this Owner
Home Financials are based on the most recent Mortgage that was taken out on this home.Home Values in the Area
Average Home Value in this Area
Purchase History
We collect this data history from publicly available records. To have your information removed, we recommend requesting removal directly through your county’s website.
| Date | Buyer | Sale Price | Title Company |
|---|---|---|---|
| -- | None Available | ||
| $156,500 | Frontier Title Company |
Mortgage History
We collect this data history from publicly available records. To have your information removed, we recommend requesting removal directly through your county’s website.
| Date | Status | Borrower | Loan Amount |
|---|---|---|---|
| Closed | $148,650 |
Tax History
We collect this data history from publicly available records. To have your information removed, we recommend requesting removal directly through your county’s website.
| Year | Tax Paid | Tax Assessment Tax Assessment Total Assessment is a certain percentage of the fair market value that is determined by local assessors to be the total taxable value of land and additions on the property. | Land | Improvement |
|---|---|---|---|---|
| 2025 | $2,983 | $262,852 | $92,375 | $170,477 |
| 2024 | $2,983 | $257,699 | $90,564 | $167,135 |
| 2023 | $2,895 | $252,647 | $88,789 | $163,858 |
| 2022 | $2,851 | $247,695 | $87,049 | $160,646 |
| 2021 | $2,814 | $242,840 | $85,343 | $157,497 |
| 2020 | $2,768 | $240,351 | $84,468 | $155,883 |
| 2019 | $2,715 | $235,639 | $82,812 | $152,827 |
| 2018 | $2,701 | $231,020 | $81,189 | $149,831 |
| 2017 | $2,633 | $226,492 | $79,598 | $146,894 |
| 2016 | $2,515 | $222,052 | $78,038 | $144,014 |
| 2015 | $2,458 | $218,717 | $76,866 | $141,851 |
| 2014 | $2,430 | $214,434 | $75,361 | $139,073 |
Map
- 1255 Watson Ranch Way
- 655 Honey Bee Rd
- 1655 Apricot Ct
- 795 Michele Ct
- 1535 Eisenhower Ct
- 1545 Patton Ct
- 1430 Roosevelt St
- 1360 Hemingway Ct
- 1355 Hemingway Ct
- 1145 Woodvale Dr
- 820 Royal Elf Ct
- 730 Park Dr
- 1690 Marenda Dr
- 610 Sierra Dr
- 730 Stratford Ave
- 1120 Oxford Ct
- 690 Woodard Way
- 445 Calmace Dr
- 1370 Estates Dr
- 1250 Redwood Ct
- 960 Mason Ct
- 970 Mason Ct
- 955 N Lincoln St
- 855 Merryfield Dr
- 965 N Lincoln St
- 965 Mason Ct
- 995 Merryfield Dr
- 975 Mason Ct
- 1005 N Lincoln St
- 1010 Mason Ct
- 930 Mason Ct
- 1025 Merryfield Dr
- 500 Merryfield Dr
- 1015 N Lincoln St
- 850 Merryfield Dr
- 1105 Merryfield Dr
- 1005 Mason Ct
- 970 Justin Way
- 1020 Mason Ct
- 920 Mason Ct
Ask me questions while you tour the home.