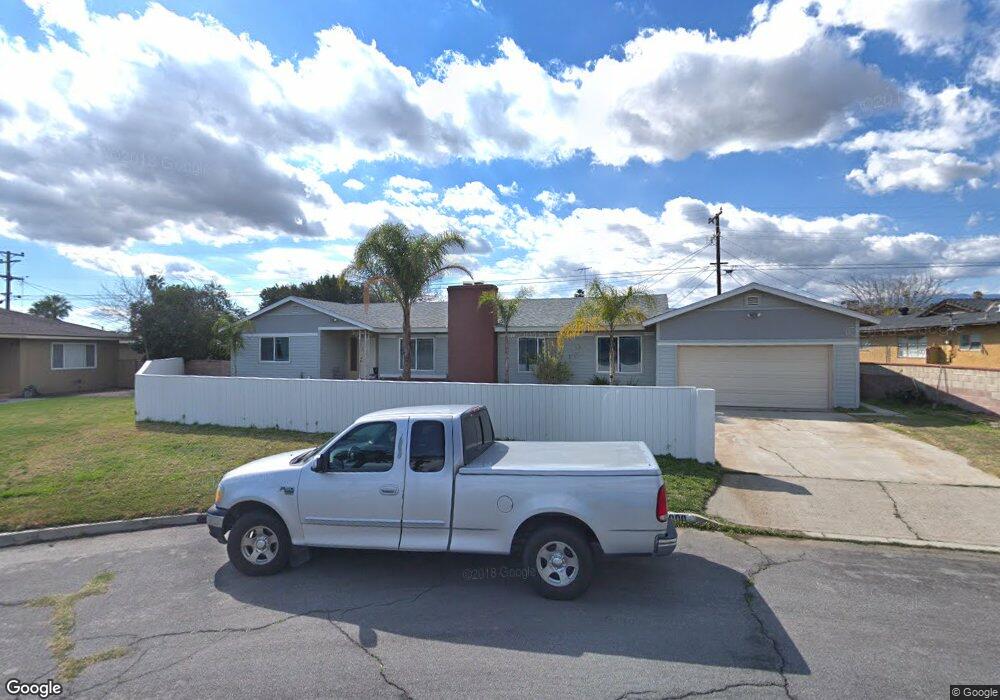
1000 N Palm Ave Rialto, CA 92376
Estimated Value: $537,929 - $617,000
4
Beds
2
Baths
1,563
Sq Ft
$365/Sq Ft
Est. Value
About This Home
This home is located at 1000 N Palm Ave, Rialto, CA 92376 and is currently estimated at $569,732, approximately $364 per square foot. 1000 N Palm Ave is a home located in San Bernardino County with nearby schools including Henry Elementary School, Kolb Middle School, and Eisenhower High School.
Ownership History
Date
Name
Owned For
Owner Type
Purchase Details
Closed on
Dec 30, 2009
Sold by
Shark Investments Llc
Bought by
Perez Roberto Peredia and Alvarez Maria Delcarmen
Current Estimated Value
Home Financials for this Owner
Home Financials are based on the most recent Mortgage that was taken out on this home.
Original Mortgage
$132,000
Interest Rate
5.02%
Mortgage Type
New Conventional
Purchase Details
Closed on
Oct 29, 2009
Sold by
Carmona Lilian Yanira
Bought by
Shark Investments Llc
Purchase Details
Closed on
Jan 3, 2007
Sold by
Wallace Marshall A
Bought by
Carmona Lilian Yanira
Home Financials for this Owner
Home Financials are based on the most recent Mortgage that was taken out on this home.
Original Mortgage
$268,800
Interest Rate
6.9%
Mortgage Type
Purchase Money Mortgage
Create a Home Valuation Report for This Property
The Home Valuation Report is an in-depth analysis detailing your home's value as well as a comparison with similar homes in the area
Home Values in the Area
Average Home Value in this Area
Purchase History
| Date | Buyer | Sale Price | Title Company |
|---|---|---|---|
| Perez Roberto Peredia | $165,000 | Fidelity Title | |
| Shark Investments Llc | -- | Cr Title Services Inc | |
| Carmona Lilian Yanira | $336,000 | Orange Coast Title Company |
Source: Public Records
Mortgage History
| Date | Status | Borrower | Loan Amount |
|---|---|---|---|
| Previous Owner | Perez Roberto Peredia | $132,000 | |
| Previous Owner | Carmona Lilian Yanira | $268,800 |
Source: Public Records
Tax History Compared to Growth
Tax History
| Year | Tax Paid | Tax Assessment Tax Assessment Total Assessment is a certain percentage of the fair market value that is determined by local assessors to be the total taxable value of land and additions on the property. | Land | Improvement |
|---|---|---|---|---|
| 2025 | $2,887 | $212,986 | $51,633 | $161,353 |
| 2024 | $2,887 | $208,810 | $50,621 | $158,189 |
| 2023 | $3,050 | $204,715 | $49,628 | $155,087 |
| 2022 | $2,823 | $200,701 | $48,655 | $152,046 |
| 2021 | $2,805 | $196,766 | $47,701 | $149,065 |
| 2020 | $2,810 | $194,749 | $47,212 | $147,537 |
| 2019 | $2,752 | $190,930 | $46,286 | $144,644 |
| 2018 | $2,659 | $187,186 | $45,378 | $141,808 |
| 2017 | $2,640 | $183,515 | $44,488 | $139,027 |
| 2016 | $2,274 | $179,917 | $43,616 | $136,301 |
| 2015 | $2,282 | $177,215 | $42,961 | $134,254 |
| 2014 | $2,145 | $173,743 | $42,119 | $131,624 |
Source: Public Records
Map
Nearby Homes
- 215 W Valencia St
- 242 W Jackson St
- 264 W Jackson St
- 153 E Jackson St
- 1018 N Millard Ave
- 885 N Millard Ave
- 991 N Magnolia Ave
- 249 E Jackson St
- 1032 N Sycamore Ave
- 836 N Millard Ave
- 1031 N Lilac Ave
- 0 N Acacia Ave Unit CV25094258
- 160 W Cascade Dr
- 332 E Rosewood St
- 530 N Sycamore Ave
- 454 E Mariposa Dr
- 590 N Lilac Ave
- 1005 N Encina Ave
- 459 W Ramona Dr
- 251 E Ramona Dr
- 1008 N Palm Ave
- 149 W Wabash St
- 1029 N Alice Ave
- 1029 N Alice Ave
- 1041 N Alice Ave
- 141 W Wabash St
- 1016 N Palm Ave
- 1009 N Palm Ave
- 182 W Madrona St
- 999 N Alice Ave
- 1053 N Alice Ave
- 1017 N Palm Ave
- 170 W Madrona St
- 133 W Wabash St
- 991 N Alice Ave
- 989 N Alice Ave
- 1024 N Palm Ave
- 1030 N Alice Ave
- 1018 N Alice Ave
- 978 N Palm Ave