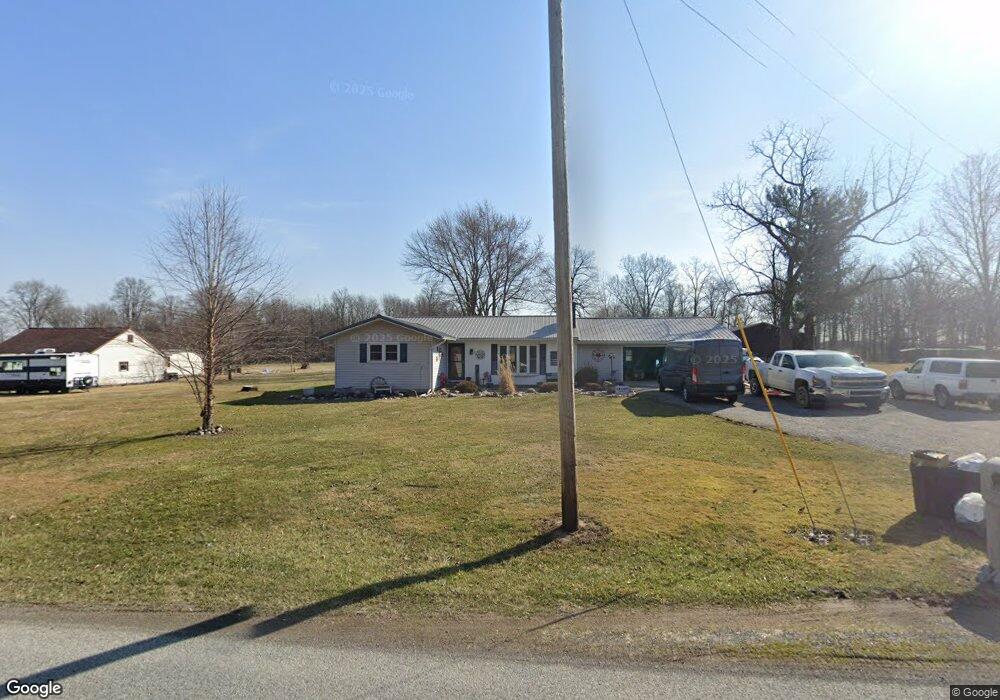
1000 N Phillips Rd Harrod, OH 45850
Estimated Value: $197,000 - $247,000
3
Beds
2
Baths
1,308
Sq Ft
$163/Sq Ft
Est. Value
About This Home
This home is located at 1000 N Phillips Rd, Harrod, OH 45850 and is currently estimated at $213,380, approximately $163 per square foot. 1000 N Phillips Rd is a home located in Allen County with nearby schools including Allen East Elementary School, Allen East Middle School, and Allen East High School.
Ownership History
Date
Name
Owned For
Owner Type
Purchase Details
Closed on
Jun 6, 2022
Sold by
Frisch Robert L
Bought by
Frisch Angi R and Frisch Robert L
Current Estimated Value
Home Financials for this Owner
Home Financials are based on the most recent Mortgage that was taken out on this home.
Original Mortgage
$106,837
Outstanding Balance
$101,495
Interest Rate
5.09%
Mortgage Type
FHA
Estimated Equity
$111,885
Purchase Details
Closed on
Dec 19, 2001
Sold by
Horn Warren D
Bought by
Frisch Robert L and Frisch Angi P
Home Financials for this Owner
Home Financials are based on the most recent Mortgage that was taken out on this home.
Original Mortgage
$71,600
Interest Rate
6.52%
Mortgage Type
New Conventional
Purchase Details
Closed on
Jan 1, 1990
Bought by
Horn Warren D
Create a Home Valuation Report for This Property
The Home Valuation Report is an in-depth analysis detailing your home's value as well as a comparison with similar homes in the area
Home Values in the Area
Average Home Value in this Area
Purchase History
| Date | Buyer | Sale Price | Title Company |
|---|---|---|---|
| Frisch Angi R | -- | Pearl James R | |
| Frisch Robert L | $89,500 | -- | |
| Horn Warren D | -- | -- |
Source: Public Records
Mortgage History
| Date | Status | Borrower | Loan Amount |
|---|---|---|---|
| Open | Frisch Angi R | $106,837 | |
| Previous Owner | Frisch Robert L | $71,600 |
Source: Public Records
Tax History Compared to Growth
Tax History
| Year | Tax Paid | Tax Assessment Tax Assessment Total Assessment is a certain percentage of the fair market value that is determined by local assessors to be the total taxable value of land and additions on the property. | Land | Improvement |
|---|---|---|---|---|
| 2024 | $1,743 | $51,170 | $8,750 | $42,420 |
| 2023 | $1,466 | $39,070 | $6,690 | $32,380 |
| 2022 | $1,477 | $39,070 | $6,690 | $32,380 |
| 2021 | $1,478 | $39,070 | $6,690 | $32,380 |
| 2020 | $1,427 | $36,720 | $6,020 | $30,700 |
| 2019 | $1,427 | $36,720 | $6,020 | $30,700 |
| 2018 | $1,367 | $36,720 | $6,020 | $30,700 |
| 2017 | $1,309 | $32,730 | $6,020 | $26,710 |
| 2016 | $1,308 | $32,730 | $6,020 | $26,710 |
| 2015 | $1,305 | $32,730 | $6,020 | $26,710 |
| 2014 | $1,302 | $31,540 | $5,710 | $25,830 |
| 2013 | $1,267 | $31,540 | $5,710 | $25,830 |
Source: Public Records
Map
Nearby Homes
- 118 E Main St
- 312 S Woodlawn Ave
- 000 Phillips Rd
- 2327 N Phillips Rd
- 647 Fisher Rd
- 663 N Mcclure Rd
- 200 S Main St
- 5496 Sandusky Rd
- 6782 County Road 15
- 4985 N Phillips Rd
- 1855 S Cool Rd
- 000 Napoleon Rd
- 7165 Faulkner Rd
- 6476 Mickelson Ln
- 6480 McPheron Rd
- 6616 Bellefontaine Rd
- 6381 McPheron Rd
- 5600 E Hanthorn Rd
- 000 Lincoln Hwy
- 4071 Township Road 35
- 980 N Phillips Rd
- 1040 N Phillips Rd
- 960 N Phillips Rd
- 930 N Phillips Rd
- 1075 N Phillips Rd
- 864 N Phillips Rd
- 1139 N Phillips Rd
- 815 N Phillips Rd
- 834 N Phillips Rd
- 782 N Phillips Rd
- 1282 N Phillips Rd
- 786 N Phillips Rd
- 765 N Phillips Rd
- 707 N Phillips Rd
- 726 N Napoleon Rd
- 1340 N Phillips Rd
- 1365 N Phillips Rd
- 596 N Phillips Rd
- 1380 N Phillips Rd