Estimated Value: $176,000 - $190,000
3
Beds
2
Baths
1,160
Sq Ft
$156/Sq Ft
Est. Value
About This Home
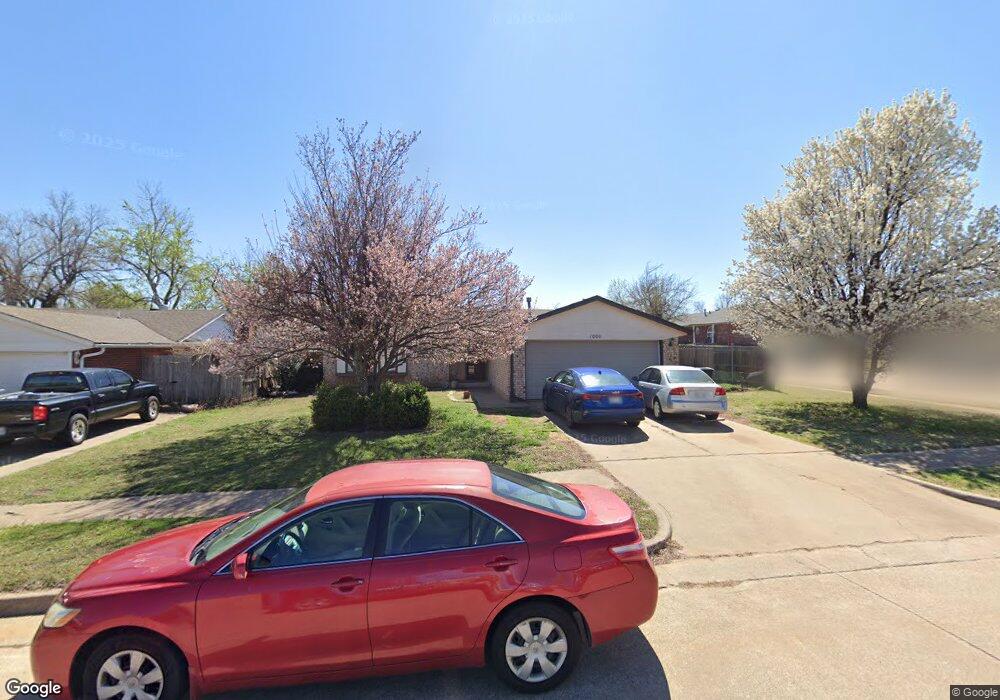
This home is located at 1000 NE 9th St, Moore, OK 73160 and is currently estimated at $181,201, approximately $156 per square foot. 1000 NE 9th St is a home located in Cleveland County with nearby schools including Winding Creek Elementary School, Central Junior High School, and Moore High School.
Ownership History
Date
Name
Owned For
Owner Type
Purchase Details
Closed on
Dec 2, 2013
Sold by
Secretary Of Hud Of Washington Dc
Bought by
Shepard Darren Keith
Current Estimated Value
Home Financials for this Owner
Home Financials are based on the most recent Mortgage that was taken out on this home.
Original Mortgage
$84,235
Outstanding Balance
$61,817
Interest Rate
4.14%
Mortgage Type
FHA
Estimated Equity
$119,384
Purchase Details
Closed on
Jun 4, 2013
Sold by
Impson Ladonna and Doe John
Bought by
Secretary Of Hud
Purchase Details
Closed on
May 14, 2007
Sold by
Taylor Jason and Taylor Stephame
Bought by
Impson La Donna
Home Financials for this Owner
Home Financials are based on the most recent Mortgage that was taken out on this home.
Original Mortgage
$99,216
Interest Rate
6.22%
Mortgage Type
FHA
Purchase Details
Closed on
Jul 30, 2004
Sold by
Huntsman John A
Bought by
Taylor Jason and Taylor Stephanie
Create a Home Valuation Report for This Property
The Home Valuation Report is an in-depth analysis detailing your home's value as well as a comparison with similar homes in the area
Home Values in the Area
Average Home Value in this Area
Purchase History
| Date | Buyer | Sale Price | Title Company |
|---|---|---|---|
| Shepard Darren Keith | -- | Fatco | |
| Secretary Of Hud | $109,713 | Oklahoma Title | |
| Impson La Donna | $100,000 | Stewart Abstract & Title Of | |
| Taylor Jason | $80,000 | -- |
Source: Public Records
Mortgage History
| Date | Status | Borrower | Loan Amount |
|---|---|---|---|
| Open | Shepard Darren Keith | $84,235 | |
| Previous Owner | Impson La Donna | $99,216 |
Source: Public Records
Tax History
| Year | Tax Paid | Tax Assessment Tax Assessment Total Assessment is a certain percentage of the fair market value that is determined by local assessors to be the total taxable value of land and additions on the property. | Land | Improvement |
|---|---|---|---|---|
| 2025 | $1,694 | $13,846 | $2,986 | $10,860 |
| 2023 | $1,531 | $12,559 | $3,061 | $9,498 |
| 2022 | $1,480 | $11,961 | $3,019 | $8,942 |
| 2021 | $1,416 | $11,392 | $2,400 | $8,992 |
| 2020 | $1,416 | $11,392 | $2,400 | $8,992 |
| 2019 | $1,442 | $11,392 | $2,400 | $8,992 |
| 2018 | $1,444 | $11,392 | $2,400 | $8,992 |
| 2017 | $1,451 | $11,392 | $0 | $0 |
| 2016 | $1,460 | $11,392 | $2,400 | $8,992 |
| 2015 | $1,321 | $11,392 | $2,400 | $8,992 |
| 2014 | $1,336 | $11,251 | $1,509 | $9,742 |
Source: Public Records
Map
Nearby Homes
- 1124 NE 8th St
- 617 Randall Dr
- 1404 Old Mill Rd
- 1508 Sequoyah Ave
- 1100 Elmhurst St
- 1109 E Hills Dr
- 904 NE 17th St
- 0 NE 12th St
- 625 Champion Ln
- 1101 Bronze Medal Rd
- 221 N English Dr
- 1401 NE 11th St
- 217 N Morgan Dr
- 109 S Patterson Dr
- 200 NE 2nd St
- 1105 Oak Creek Dr
- 1013 Oak Creek Dr
- 1521 NE 1st St
- 1113 NE 21st Ct
- 300 S English Dr
- 1006 NE 9th St
- 904 N Silver Leaf Dr
- 1012 NE 9th St
- 924 NE 9th St
- 905 N Silver Leaf Dr
- 1001 NE 9th St
- 1007 NE 9th St
- 901 N Patterson Dr
- 1018 NE 9th St
- 905 Wilkinson Dr
- 918 NE 9th St
- 1013 NE 9th St
- 925 NE 9th St
- 905 N Patterson Dr
- 1024 NE 9th St
- 1019 NE 9th St
- 919 NE 9th St
- 909 N Patterson Dr
- 901 Wilkinson Dr
- 912 NE 9th St
Your Personal Tour Guide
Ask me questions while you tour the home.