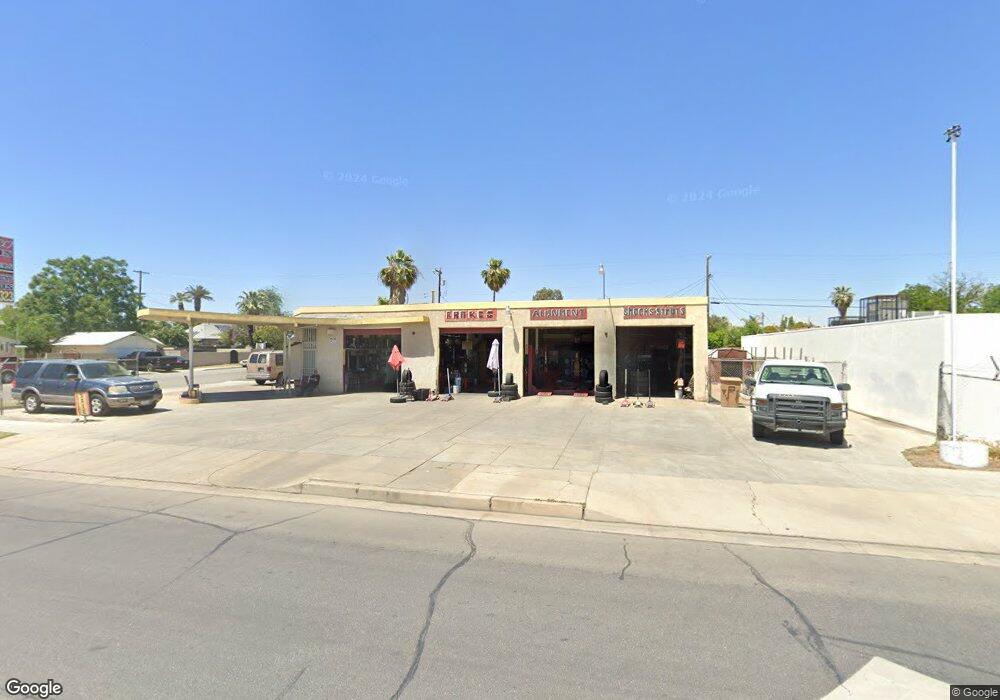
1000 Niles St Bakersfield, CA 93305
East Bakersfield NeighborhoodEstimated Value: $231,851
--
Bed
--
Bath
2,400
Sq Ft
$97/Sq Ft
Est. Value
About This Home
This home is located at 1000 Niles St, Bakersfield, CA 93305 and is currently estimated at $231,851, approximately $96 per square foot. 1000 Niles St is a home located in Kern County with nearby schools including Jefferson Elementary School, Walter Stiern Middle School, and East Bakersfield High School.
Ownership History
Date
Name
Owned For
Owner Type
Purchase Details
Closed on
Mar 28, 2014
Sold by
Flores Francisco and Marin Alejandra
Bought by
Flores Sergio A and Flores Amparo
Current Estimated Value
Purchase Details
Closed on
Apr 25, 2005
Sold by
Tate Roy Allen and Tate Lori E
Bought by
Flores Francisco and Marin Alejandra
Home Financials for this Owner
Home Financials are based on the most recent Mortgage that was taken out on this home.
Original Mortgage
$106,555
Interest Rate
5.58%
Mortgage Type
Seller Take Back
Purchase Details
Closed on
May 13, 2002
Sold by
Mettlers Automotive Inc
Bought by
Tate Roy Allen and Tate Lori E
Home Financials for this Owner
Home Financials are based on the most recent Mortgage that was taken out on this home.
Original Mortgage
$58,000
Interest Rate
7.13%
Mortgage Type
Seller Take Back
Create a Home Valuation Report for This Property
The Home Valuation Report is an in-depth analysis detailing your home's value as well as a comparison with similar homes in the area
Home Values in the Area
Average Home Value in this Area
Purchase History
| Date | Buyer | Sale Price | Title Company |
|---|---|---|---|
| Flores Sergio A | -- | None Available | |
| Flores Francisco | -- | Stewart Title | |
| Tate Roy Allen | $68,000 | American Title Co |
Source: Public Records
Mortgage History
| Date | Status | Borrower | Loan Amount |
|---|---|---|---|
| Previous Owner | Flores Francisco | $106,555 | |
| Previous Owner | Tate Roy Allen | $58,000 |
Source: Public Records
Tax History Compared to Growth
Tax History
| Year | Tax Paid | Tax Assessment Tax Assessment Total Assessment is a certain percentage of the fair market value that is determined by local assessors to be the total taxable value of land and additions on the property. | Land | Improvement |
|---|---|---|---|---|
| 2025 | $3,169 | $253,800 | $37,812 | $215,988 |
| 2024 | $3,111 | $248,825 | $37,071 | $211,754 |
| 2023 | $3,111 | $243,947 | $36,345 | $207,602 |
| 2022 | $3,061 | $239,165 | $35,633 | $203,532 |
| 2021 | $3,134 | $234,477 | $34,935 | $199,542 |
| 2020 | $3,128 | $232,073 | $34,577 | $197,496 |
| 2019 | $3,072 | $232,073 | $34,577 | $197,496 |
| 2018 | $3,002 | $223,064 | $33,236 | $189,828 |
| 2017 | $2,993 | $218,692 | $32,585 | $186,107 |
| 2016 | $2,722 | $214,404 | $31,946 | $182,458 |
| 2015 | $2,711 | $211,185 | $31,467 | $179,718 |
| 2014 | $2,926 | $234,100 | $45,703 | $188,397 |
Source: Public Records
Map
Nearby Homes
- 1000 Monterey St
- 1107 Monterey St
- 1312 Robinson St
- 1108 Pacific St
- 1009 Lake St
- 1200 Oregon St
- 1331 Beale Ave
- 1018 Gage St
- 920 Kentucky St
- 1524 Beale Ave
- 800 Pacific St
- 804 Kentucky St
- 1311 Oregon St
- 1231 Quincy St
- 1026 Flower St
- 805 Kentucky St
- 1414 Monterey St
- 1322 Quincy St
- 1322 Kentucky St
- 1309 Flower St