Estimated Value: $297,000 - $343,000
3
Beds
2
Baths
1,484
Sq Ft
$212/Sq Ft
Est. Value
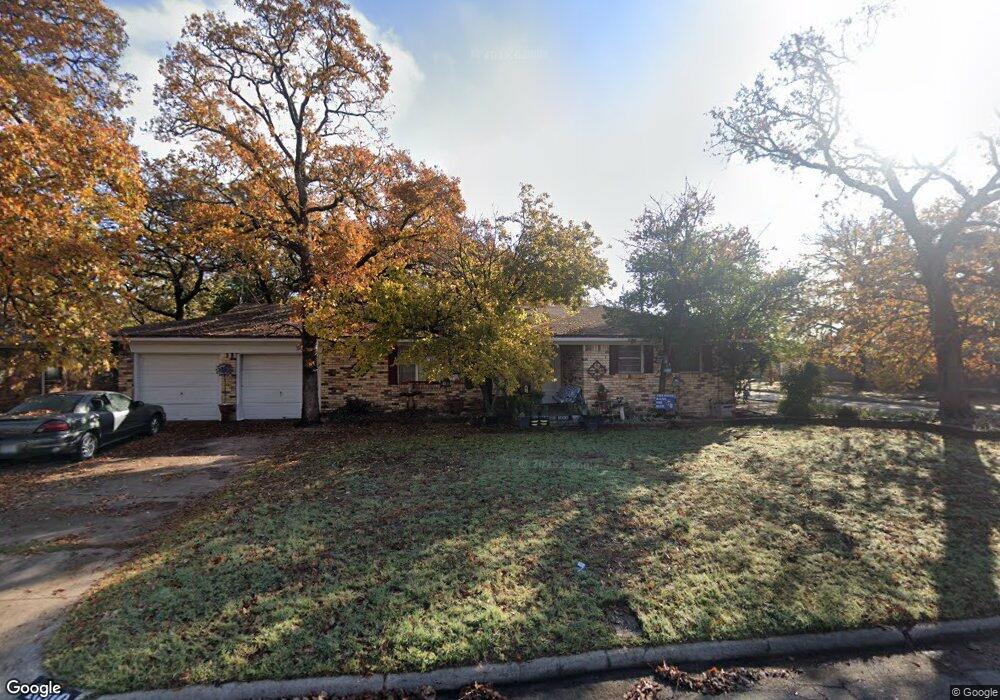
About This Home
This home is located at 1000 Reed St, Hurst, TX 76053 and is currently estimated at $313,913, approximately $211 per square foot. 1000 Reed St is a home located in Tarrant County with nearby schools including Harrison Lane Elementary School, Hurst J High School, and L.D. Bell High School.
Ownership History
Date
Name
Owned For
Owner Type
Purchase Details
Closed on
May 24, 2001
Sold by
Disinski Lorie D and Doyle Lorie Marie
Bought by
Disinski Richard and Disinski Lorie D
Current Estimated Value
Home Financials for this Owner
Home Financials are based on the most recent Mortgage that was taken out on this home.
Original Mortgage
$40,000
Interest Rate
11.9%
Mortgage Type
Credit Line Revolving
Create a Home Valuation Report for This Property
The Home Valuation Report is an in-depth analysis detailing your home's value as well as a comparison with similar homes in the area
Home Values in the Area
Average Home Value in this Area
Purchase History
| Date | Buyer | Sale Price | Title Company |
|---|---|---|---|
| Disinski Richard | -- | Safeco Land Title |
Source: Public Records
Mortgage History
| Date | Status | Borrower | Loan Amount |
|---|---|---|---|
| Closed | Disinski Richard | $40,000 |
Source: Public Records
Tax History Compared to Growth
Tax History
| Year | Tax Paid | Tax Assessment Tax Assessment Total Assessment is a certain percentage of the fair market value that is determined by local assessors to be the total taxable value of land and additions on the property. | Land | Improvement |
|---|---|---|---|---|
| 2025 | $2,808 | $269,118 | $65,000 | $204,118 |
| 2024 | $2,808 | $269,118 | $65,000 | $204,118 |
| 2023 | $3,771 | $248,369 | $40,000 | $208,369 |
| 2022 | $3,939 | $228,771 | $40,000 | $188,771 |
| 2021 | $3,751 | $204,470 | $40,000 | $164,470 |
| 2020 | $3,402 | $177,927 | $40,000 | $137,927 |
| 2019 | $3,146 | $170,119 | $40,000 | $130,119 |
| 2018 | $2,343 | $116,862 | $19,000 | $97,862 |
| 2017 | $2,688 | $138,788 | $19,000 | $119,788 |
| 2016 | $2,444 | $117,044 | $19,000 | $98,044 |
| 2015 | $1,921 | $87,800 | $15,000 | $72,800 |
| 2014 | $1,921 | $87,800 | $15,000 | $72,800 |
Source: Public Records
Map
Nearby Homes