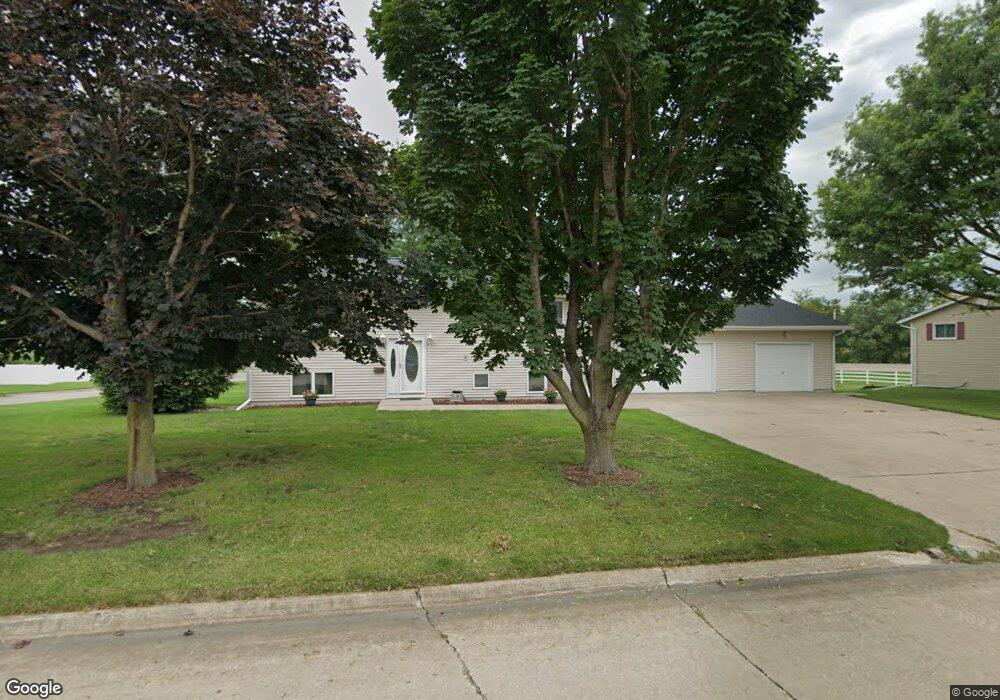
1000 W 17th St Vinton, IA 52349
Estimated Value: $223,587 - $256,000
3
Beds
2
Baths
1,040
Sq Ft
$226/Sq Ft
Est. Value
About This Home
This home is located at 1000 W 17th St, Vinton, IA 52349 and is currently estimated at $234,897, approximately $225 per square foot. 1000 W 17th St is a home located in Benton County with nearby schools including Tilford Elementary School, Shellsburg Elementary School, and Vinton-Shellsburg Middle School.
Ownership History
Date
Name
Owned For
Owner Type
Purchase Details
Closed on
Sep 21, 2021
Sold by
Grimes Walter R
Bought by
Grimes Ruth A
Current Estimated Value
Purchase Details
Closed on
May 2, 2005
Sold by
Timmer Alfred Mark and Timmer Carol M
Bought by
Grimes Walter R and Grimes Ruth A
Home Financials for this Owner
Home Financials are based on the most recent Mortgage that was taken out on this home.
Original Mortgage
$110,000
Interest Rate
6.05%
Mortgage Type
Purchase Money Mortgage
Create a Home Valuation Report for This Property
The Home Valuation Report is an in-depth analysis detailing your home's value as well as a comparison with similar homes in the area
Home Values in the Area
Average Home Value in this Area
Purchase History
| Date | Buyer | Sale Price | Title Company |
|---|---|---|---|
| Grimes Ruth A | -- | -- | |
| Grimes Walter R | $150,000 | None Available |
Source: Public Records
Mortgage History
| Date | Status | Borrower | Loan Amount |
|---|---|---|---|
| Previous Owner | Grimes Walter R | $110,000 |
Source: Public Records
Tax History Compared to Growth
Tax History
| Year | Tax Paid | Tax Assessment Tax Assessment Total Assessment is a certain percentage of the fair market value that is determined by local assessors to be the total taxable value of land and additions on the property. | Land | Improvement |
|---|---|---|---|---|
| 2025 | $3,002 | $204,100 | $30,100 | $174,000 |
| 2024 | $3,002 | $184,100 | $29,600 | $154,500 |
| 2023 | $3,022 | $184,100 | $29,600 | $154,500 |
| 2022 | $3,100 | $149,300 | $23,700 | $125,600 |
| 2021 | $3,100 | $149,300 | $23,700 | $125,600 |
| 2020 | $3,000 | $147,400 | $22,700 | $124,700 |
| 2019 | $2,992 | $147,400 | $22,700 | $124,700 |
| 2018 | $2,902 | $145,000 | $21,700 | $123,300 |
| 2017 | $2,786 | $145,000 | $21,700 | $123,300 |
| 2016 | $2,736 | $135,500 | $20,300 | $115,200 |
| 2015 | $2,736 | $135,500 | $20,300 | $115,200 |
| 2014 | $2,700 | $133,600 | $0 | $0 |
Source: Public Records
Map
Nearby Homes