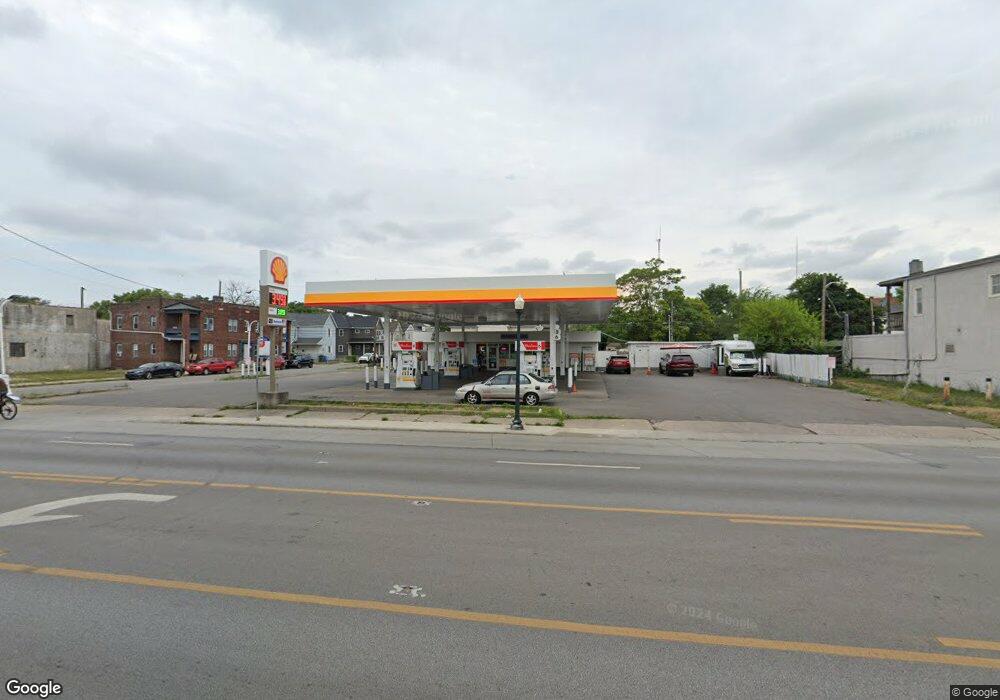
1000 W Broad St Columbus, OH 43222
Franklinton Neighborhood
--
Bed
--
Bath
1,000
Sq Ft
10,759
Sq Ft Lot
About This Home
This home is located at 1000 W Broad St, Columbus, OH 43222. 1000 W Broad St is a home located in Franklin County with nearby schools including Avondale Elementary School, Starling PK-8, and West High School.
Ownership History
Date
Name
Owned For
Owner Type
Purchase Details
Closed on
Oct 5, 2018
Sold by
West Broad Petroleum Inc
Bought by
Ksr Investments Llc
Home Financials for this Owner
Home Financials are based on the most recent Mortgage that was taken out on this home.
Original Mortgage
$860,000
Outstanding Balance
$708,065
Interest Rate
4.5%
Mortgage Type
Commercial
Purchase Details
Closed on
Oct 2, 2017
Sold by
Sunshine Plus Inc
Bought by
West Broad Petroleum Inc
Home Financials for this Owner
Home Financials are based on the most recent Mortgage that was taken out on this home.
Original Mortgage
$392,000
Interest Rate
3.86%
Mortgage Type
Commercial
Purchase Details
Closed on
May 3, 2001
Sold by
Speedway Superamerica Llc
Bought by
Sunshine Plus Inc
Home Financials for this Owner
Home Financials are based on the most recent Mortgage that was taken out on this home.
Original Mortgage
$175,000
Interest Rate
6.99%
Mortgage Type
Commercial
Purchase Details
Closed on
Sep 5, 1962
Bought by
Bonded Oil Co The
Create a Home Valuation Report for This Property
The Home Valuation Report is an in-depth analysis detailing your home's value as well as a comparison with similar homes in the area
Home Values in the Area
Average Home Value in this Area
Purchase History
| Date | Buyer | Sale Price | Title Company |
|---|---|---|---|
| Ksr Investments Llc | $510,000 | Associates Title Box | |
| West Broad Petroleum Inc | $490,000 | Stella Title Agency Inc | |
| Sunshine Plus Inc | $400,000 | Superior Title Svcs Agency I | |
| Bonded Oil Co The | -- | -- |
Source: Public Records
Mortgage History
| Date | Status | Borrower | Loan Amount |
|---|---|---|---|
| Open | Ksr Investments Llc | $860,000 | |
| Previous Owner | West Broad Petroleum Inc | $392,000 | |
| Previous Owner | Sunshine Plus Inc | $175,000 |
Source: Public Records
Tax History Compared to Growth
Tax History
| Year | Tax Paid | Tax Assessment Tax Assessment Total Assessment is a certain percentage of the fair market value that is determined by local assessors to be the total taxable value of land and additions on the property. | Land | Improvement |
|---|---|---|---|---|
| 2024 | $9,254 | $117,330 | $30,070 | $87,260 |
| 2023 | $9,172 | $117,320 | $30,065 | $87,255 |
| 2022 | $11,006 | $117,110 | $22,540 | $94,570 |
| 2021 | $9,365 | $117,110 | $22,540 | $94,570 |
| 2020 | $9,304 | $117,110 | $22,540 | $94,570 |
| 2019 | $9,645 | $117,110 | $22,540 | $94,570 |
| 2018 | $4,031 | $117,110 | $22,540 | $94,570 |
| 2017 | $4,189 | $49,810 | $22,540 | $27,270 |
| 2016 | $4,280 | $49,180 | $22,540 | $26,640 |
| 2015 | $3,974 | $49,180 | $22,540 | $26,640 |
| 2014 | $3,972 | $49,180 | $22,540 | $26,640 |
| 2013 | $1,968 | $49,175 | $22,540 | $26,635 |
Source: Public Records
Map
Nearby Homes
- 53-55 Hawkes Ave
- 72 Avondale Ave
- 78 Hawkes Ave
- 61 Dakota Ave
- 69 Rodgers Ave
- 33 N Hartford Ave
- 45 S Hartford Ave
- 49 S Hartford Ave
- 45 N Hartford Ave
- The Summit Plan at Homes on Hartford - Single Family
- 112 S Cypress Ave
- 1020-1026 Cable Ave
- 186 Avondale Ave Unit 188
- 211 Dakota Ave
- 37-39 S Yale Ave
- 49 S Yale Ave
- 273 Avondale Ave
- 148 W Park Ave
- 286 Avondale Ave
- 116 W Park Ave
- 15 Rodgers Ave Unit 19
- 1012 W Broad St
- 0 118-118 1 2 Rodgers Ave
- 1 Rodgers Ave
- 28 Rodgers Ave
- 1022 W Broad St
- 27 Rodgers Ave
- 27 Rodgers Ave Unit 1/2
- 1026 W Broad St
- 34 Rodgers Ave Unit 36
- 25 Meek Ave
- 7 Avondale Ave
- 29 Rodgers Ave Unit 31
- 29-31 Rodgers Ave
- 27 Meek Ave Unit 29
- 38 Rodgers Ave
- 35 Rodgers Ave
- 1009 W Broad St
- 27-29 Meek Ave
- 42 Rodgers Ave