Estimated Value: $1,908,705
--
Bed
7
Baths
8,750
Sq Ft
$218/Sq Ft
Est. Value
About This Home
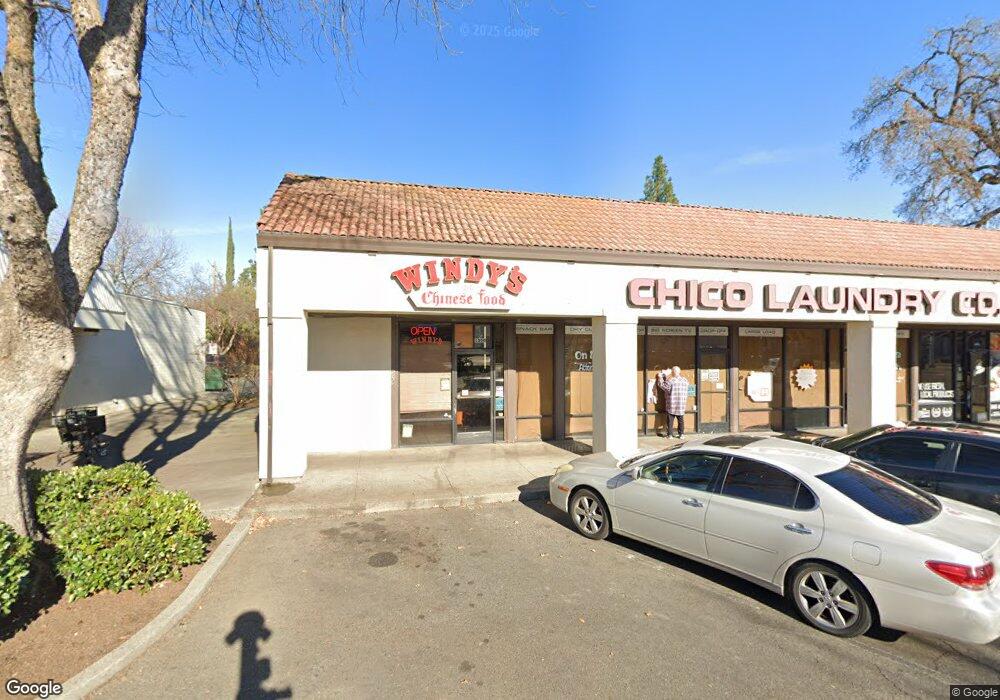
This home is located at 1000 W Sacramento Ave Unit A, Chico, CA 95926 and is currently estimated at $1,908,705, approximately $218 per square foot. 1000 W Sacramento Ave Unit A is a home located in Butte County with nearby schools including Citrus Avenue Elementary School, Chico Junior High School, and Chico High School.
Ownership History
Date
Name
Owned For
Owner Type
Purchase Details
Closed on
Aug 24, 2020
Sold by
Harris Jennifer and The Dorothy M Harris Trust
Bought by
Holman Realty Corporation
Current Estimated Value
Home Financials for this Owner
Home Financials are based on the most recent Mortgage that was taken out on this home.
Original Mortgage
$1,092,000
Outstanding Balance
$576,389
Interest Rate
2.9%
Mortgage Type
Purchase Money Mortgage
Estimated Equity
$1,332,316
Purchase Details
Closed on
Aug 21, 2020
Sold by
Holman Realty Corporation
Bought by
Alegria Eric and Alegria Christine
Home Financials for this Owner
Home Financials are based on the most recent Mortgage that was taken out on this home.
Original Mortgage
$1,092,000
Outstanding Balance
$576,389
Interest Rate
2.9%
Mortgage Type
Purchase Money Mortgage
Estimated Equity
$1,332,316
Purchase Details
Closed on
Sep 13, 1999
Sold by
Harris Malcolm M and The Malcolm M Harris
Bought by
Holman Realty Corp
Create a Home Valuation Report for This Property
The Home Valuation Report is an in-depth analysis detailing your home's value as well as a comparison with similar homes in the area
Home Values in the Area
Average Home Value in this Area
Purchase History
| Date | Buyer | Sale Price | Title Company |
|---|---|---|---|
| Holman Realty Corporation | -- | Fidelity National Title Co | |
| Alegria Eric | $1,612,000 | Fidelity Natl Ttl Co Of Ca | |
| Holman Realty Corp | -- | -- |
Source: Public Records
Mortgage History
| Date | Status | Borrower | Loan Amount |
|---|---|---|---|
| Open | Alegria Eric | $1,092,000 |
Source: Public Records
Tax History Compared to Growth
Tax History
| Year | Tax Paid | Tax Assessment Tax Assessment Total Assessment is a certain percentage of the fair market value that is determined by local assessors to be the total taxable value of land and additions on the property. | Land | Improvement |
|---|---|---|---|---|
| 2025 | $19,442 | $1,795,336 | $757,701 | $1,037,635 |
| 2024 | $19,442 | $1,760,135 | $742,845 | $1,017,290 |
| 2023 | $19,212 | $1,725,624 | $728,280 | $997,344 |
| 2022 | $18,378 | $1,644,240 | $714,000 | $930,240 |
| 2021 | $18,032 | $1,612,000 | $700,000 | $912,000 |
| 2020 | $14,259 | $1,264,827 | $281,069 | $983,758 |
| 2019 | $14,000 | $1,240,027 | $275,558 | $964,469 |
| 2018 | $13,743 | $1,215,713 | $270,155 | $945,558 |
| 2017 | $13,466 | $1,191,876 | $264,858 | $927,018 |
| 2016 | $12,288 | $1,168,507 | $259,665 | $908,842 |
| 2015 | $12,289 | $1,150,956 | $255,765 | $895,191 |
| 2014 | $11,992 | $1,128,411 | $250,755 | $877,656 |
Source: Public Records
Map
Nearby Homes
- 810 W 1st Ave
- 1114 Nord Ave Unit 8
- 1114 Nord Ave Unit 11
- 1114 Nord Ave Unit 17
- 23 Carriage Ln
- 1528 Bidwell Dr
- 703 W 2nd Ave
- 642 W 1st Ave
- 115 Hampshire Dr
- 1397 Nord Ave
- 1395 Nord Ave
- 1122 Stewart Ave
- 1131 Stewart Ave
- 1220 Bidwell Ave
- 1412 N Cherry St Unit 9
- 661 Victorian Park Dr
- 1036 Gateway Ln
- 65 Sunbury Rd
- 345 W 1st Ave
- 325 W 1st Ave
- 1000 W Sacramento Ave
- 1000 W Sacramento Ave Unit C
- 1000 W Sacramento Ave Unit B
- 1008 W Sacramento Ave Unit G
- 1008 W Sacramento Ave Unit E
- 1008 W Sacramento Ave Unit B
- 1008 W Sacramento Ave Unit C
- 1008 W Sacramento Ave Unit H
- 1008 W Sacramento Ave Unit F
- 1008 W Sacramento Ave
- 1008 W Sacramento Ave Unit A
- 1008 W Sacramento Ave Unit I
- 932 Nord Ave
- 930 W Sacramento Ave
- 924 Nord Ave
- 0 Columbus Ave Unit 200908288
- 0 Columbus Ave
- 920 W Sacramento Ave
- 931 W Sacramento Ave
- 1001 W Sacramento Ave