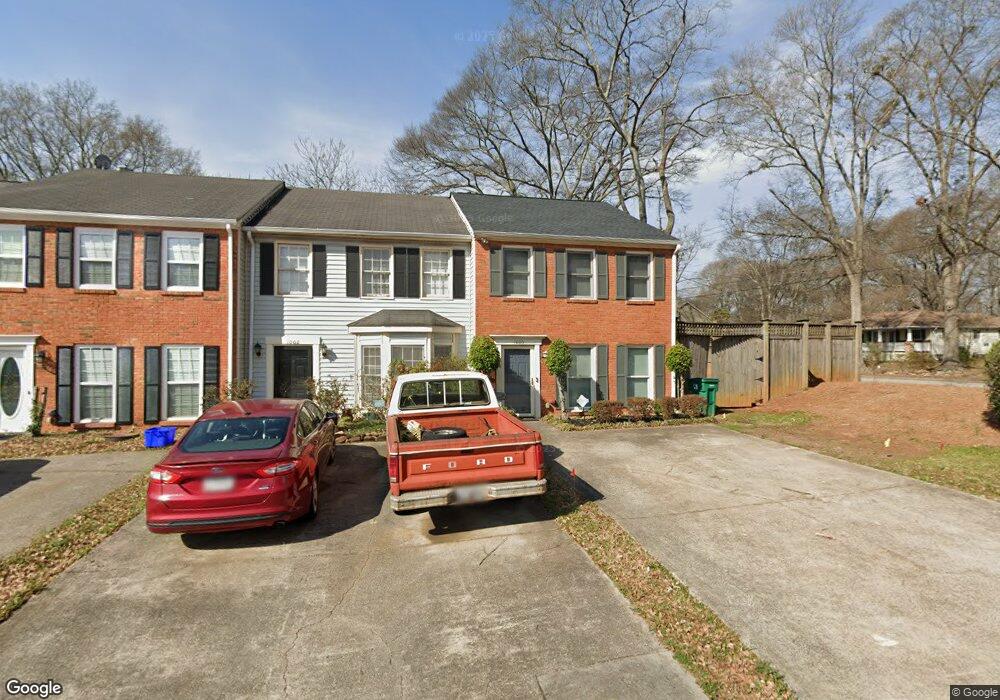
1000 Windy Oaks Ct SE Smyrna, GA 30080
Estimated Value: $310,716 - $325,000
2
Beds
3
Baths
1,360
Sq Ft
$232/Sq Ft
Est. Value
About This Home
This home is located at 1000 Windy Oaks Ct SE, Smyrna, GA 30080 and is currently estimated at $316,179, approximately $232 per square foot. 1000 Windy Oaks Ct SE is a home located in Cobb County with nearby schools including Smyrna Elementary School, Campbell Middle School, and Campbell High School.
Ownership History
Date
Name
Owned For
Owner Type
Purchase Details
Closed on
Feb 5, 2025
Sold by
Engel Michael Andreas
Bought by
Abney Beth Lynn
Current Estimated Value
Home Financials for this Owner
Home Financials are based on the most recent Mortgage that was taken out on this home.
Original Mortgage
$304,000
Outstanding Balance
$301,905
Interest Rate
6.85%
Mortgage Type
New Conventional
Estimated Equity
$14,274
Purchase Details
Closed on
Nov 14, 2008
Sold by
Bank Of New York Trust
Bought by
Engel Michael
Purchase Details
Closed on
Oct 7, 2008
Sold by
Renfroe Louis
Bought by
Jpmorgan Chase Bank Na
Purchase Details
Closed on
Jul 8, 2003
Sold by
Vidal Maria D
Bought by
Renfroe Louis
Home Financials for this Owner
Home Financials are based on the most recent Mortgage that was taken out on this home.
Original Mortgage
$89,300
Interest Rate
5.2%
Mortgage Type
New Conventional
Purchase Details
Closed on
Apr 29, 1996
Sold by
Mitchell Brenda J
Bought by
Vidal Maria
Create a Home Valuation Report for This Property
The Home Valuation Report is an in-depth analysis detailing your home's value as well as a comparison with similar homes in the area
Home Values in the Area
Average Home Value in this Area
Purchase History
| Date | Buyer | Sale Price | Title Company |
|---|---|---|---|
| Abney Beth Lynn | $320,000 | None Listed On Document | |
| Abney Beth Lynn | $320,000 | None Listed On Document | |
| Engel Michael | $75,500 | -- | |
| Jpmorgan Chase Bank Na | $85,000 | -- | |
| Renfroe Louis | $94,000 | -- | |
| Vidal Maria | $58,500 | -- |
Source: Public Records
Mortgage History
| Date | Status | Borrower | Loan Amount |
|---|---|---|---|
| Open | Abney Beth Lynn | $304,000 | |
| Closed | Abney Beth Lynn | $304,000 | |
| Previous Owner | Renfroe Louis | $89,300 | |
| Closed | Vidal Maria | $0 |
Source: Public Records
Tax History Compared to Growth
Tax History
| Year | Tax Paid | Tax Assessment Tax Assessment Total Assessment is a certain percentage of the fair market value that is determined by local assessors to be the total taxable value of land and additions on the property. | Land | Improvement |
|---|---|---|---|---|
| 2025 | $3,350 | $123,328 | $34,000 | $89,328 |
| 2024 | $2,917 | $107,396 | $34,000 | $73,396 |
| 2023 | $2,952 | $108,704 | $34,000 | $74,704 |
| 2022 | $1,681 | $61,436 | $12,000 | $49,436 |
| 2021 | $1,689 | $61,436 | $12,000 | $49,436 |
| 2020 | $1,689 | $61,436 | $12,000 | $49,436 |
| 2019 | $1,495 | $54,384 | $12,000 | $42,384 |
| 2018 | $1,495 | $54,384 | $12,000 | $42,384 |
| 2017 | $1,403 | $54,384 | $12,000 | $42,384 |
| 2016 | $1,403 | $54,384 | $12,000 | $42,384 |
| 2015 | $471 | $17,844 | $3,200 | $14,644 |
| 2014 | $476 | $17,844 | $0 | $0 |
Source: Public Records
Map
Nearby Homes
- 1461 Hawthorne Ave SE
- 1764 Whitfield Parc Cir
- 1761 Whitfield Parc Cir SE
- 3001 Hawthorne Place SE
- 1417 Springleaf Cir SE
- 1768 Evenstad Way
- 3037 Ferrington Way
- 1579 Walker St SE
- 2908 Cottesford Way SE
- 1385 Hawthorne Ave SE
- 1365 Hawthorne Ave SE
- 1436 Belmont Ave SE
- 1451 Belmont Ave SE
- 1537 Springleaf Cove SE
- 2781 Mathews St SE
- 2801 Priestcliff Dr SE
- 1700 Wynndowne Trail SE Unit C
- 2909 Ferrington Way
- 1002 Windy Oaks Ct SE
- 1004 Windy Oaks Ct SE
- 1006 Windy Oaks Ct SE
- 1010 Windy Oaks Ct SE
- 1010 Windy Oaks Ct SE Unit 1010
- 0 Windy Oaks Ct Unit 7447894
- 1001 Windy Oaks Ct SE
- 1001 Windy Oaks Ct SE Unit 1001
- 1005 Windy Oaks Ct SE
- 1005 Windy Oaks Ct SE Unit 1005
- 1500 Roswell St SE
- 1007 Windy Oaks Ct SE
- 1020 Windy Oaks Ct SE
- 1003 Windy Oaks Ct SE
- 1022 Windy Oaks Ct SE
- 1009 Windy Oaks Ct SE
- 1496 Roswell St SE
- 1011 Windy Oaks Ct SE
- 1024 Windy Oaks Ct SE
- 1026 Windy Oaks Ct SE