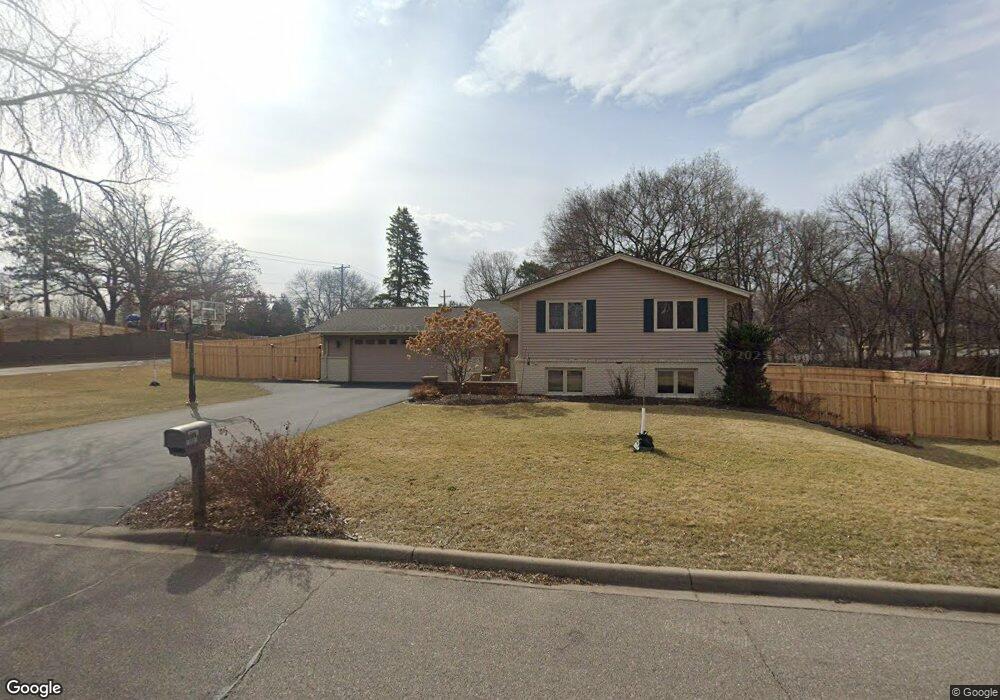
10001 Windsor Lake Ln Hopkins, MN 55305
Estimated Value: $551,000 - $616,000
5
Beds
3
Baths
3,122
Sq Ft
$187/Sq Ft
Est. Value
About This Home
This home is located at 10001 Windsor Lake Ln, Hopkins, MN 55305 and is currently estimated at $583,938, approximately $187 per square foot. 10001 Windsor Lake Ln is a home located in Hennepin County with nearby schools including L.H. Tanglen Elementary School, Hopkins North Junior High School, and Hopkins Senior High School.
Ownership History
Date
Name
Owned For
Owner Type
Purchase Details
Closed on
Aug 12, 2022
Sold by
Rutlen Craig and Rutlen Debra
Bought by
Foertsch Jeremiah and Foertsch Stephanie
Current Estimated Value
Home Financials for this Owner
Home Financials are based on the most recent Mortgage that was taken out on this home.
Original Mortgage
$437,138
Outstanding Balance
$421,255
Interest Rate
5.7%
Mortgage Type
New Conventional
Estimated Equity
$162,683
Purchase Details
Closed on
Aug 2, 2022
Sold by
Rutlen Craig L and Rutlen Debra A
Bought by
Foertsch Jeremiah and Foertsch Stephanie
Home Financials for this Owner
Home Financials are based on the most recent Mortgage that was taken out on this home.
Original Mortgage
$437,138
Outstanding Balance
$421,255
Interest Rate
5.7%
Mortgage Type
New Conventional
Estimated Equity
$162,683
Purchase Details
Closed on
Nov 7, 1997
Sold by
Declercq Nicole Marie Plante and Plante Richard James
Bought by
Rutlen Craig L and Rutlen Debra A
Create a Home Valuation Report for This Property
The Home Valuation Report is an in-depth analysis detailing your home's value as well as a comparison with similar homes in the area
Home Values in the Area
Average Home Value in this Area
Purchase History
| Date | Buyer | Sale Price | Title Company |
|---|---|---|---|
| Foertsch Jeremiah | $555,555 | -- | |
| Foertsch Jeremiah | $555,555 | None Listed On Document | |
| Rutlen Craig L | $210,000 | -- |
Source: Public Records
Mortgage History
| Date | Status | Borrower | Loan Amount |
|---|---|---|---|
| Open | Foertsch Jeremiah | $100,000 | |
| Open | Foertsch Jeremiah | $437,138 | |
| Closed | Foertsch Jeremiah | $444,444 | |
| Previous Owner | Rutlen Craig L | $50,000 | |
| Previous Owner | Rutlen Craig L | $214,500 |
Source: Public Records
Tax History Compared to Growth
Tax History
| Year | Tax Paid | Tax Assessment Tax Assessment Total Assessment is a certain percentage of the fair market value that is determined by local assessors to be the total taxable value of land and additions on the property. | Land | Improvement |
|---|---|---|---|---|
| 2024 | $6,636 | $533,900 | $206,900 | $327,000 |
| 2023 | $5,867 | $496,400 | $206,900 | $289,500 |
| 2022 | $5,067 | $463,900 | $196,300 | $267,600 |
| 2021 | $4,673 | $403,400 | $178,400 | $225,000 |
| 2020 | $4,782 | $378,600 | $178,400 | $200,200 |
| 2019 | $4,387 | $368,000 | $178,400 | $189,600 |
| 2018 | $4,222 | $342,800 | $178,400 | $164,400 |
| 2017 | $4,356 | $325,100 | $161,700 | $163,400 |
| 2016 | $4,606 | $333,000 | $151,900 | $181,100 |
| 2015 | $4,322 | $307,800 | $147,000 | $160,800 |
| 2014 | -- | $273,200 | $147,000 | $126,200 |
Source: Public Records
Map
Nearby Homes
- 9821 Enclave Dr
- 1908 Ford Rd
- 2204 Country Ln
- 1896 Yorkshire Ave S
- 1647 Ford Rd
- 10309 Lakeview Dr W
- TBD Lakeview Dr W
- 9234 W 22nd St
- 1435 Ford Rd
- 10408 Belmont Rd
- 2515 Royals Dr
- 2311 Gettysburg Ave S
- 2420 Gettysburg Ave S
- 10003 Crestridge Dr
- 9109 W 22nd St
- 9109 W 23rd St
- 10605 Crestridge Dr
- 10211 Cedar Lake Rd Unit 204
- 10211 Cedar Lake Rd Unit 208
- 10211 Cedar Lake Rd Unit 109
- 2120 Ford Rd
- 10021 Windsor Lake Ln
- 10000 Windsor Lake Ln
- 10020 Windsor Lake Ln
- 2010 Ford Rd
- 2019 Ford Rd
- 2200 Ford Rd
- 10121 Windsor Lake Ln
- 10100 Windsor Lake Ln
- 2011 Ford Rd
- 2000 Ford Rd
- 9967 Enclave Dr
- 10016 Kingman Ln
- 2208 Ford Rd
- 2001 Yorkshire Ave S
- 10108 Windsor Lake Ln
- 2003 Ford Rd
- 10129 Windsor Lake Ln
- 10100 Kingman Ln
- 9989 Enclave Dr