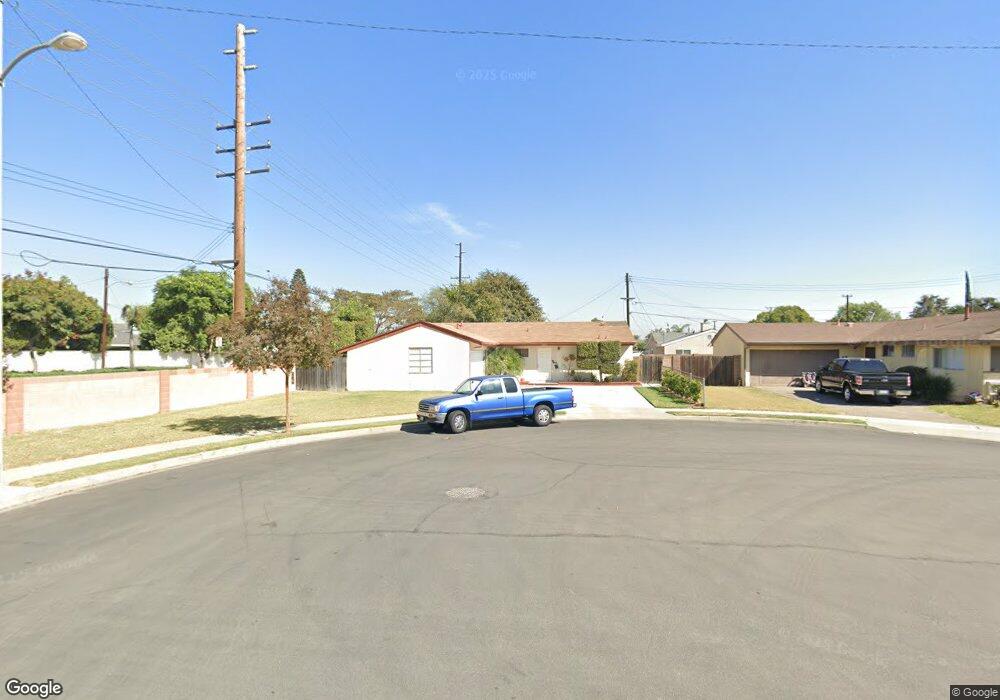
10002 Saint John Cir Cypress, CA 90630
Estimated Value: $928,000 - $976,000
4
Beds
2
Baths
1,248
Sq Ft
$767/Sq Ft
Est. Value
About This Home
This home is located at 10002 Saint John Cir, Cypress, CA 90630 and is currently estimated at $957,143, approximately $766 per square foot. 10002 Saint John Cir is a home located in Orange County with nearby schools including Juliet Morris Elementary School, Lexington Junior High School, and Cypress High School.
Ownership History
Date
Name
Owned For
Owner Type
Purchase Details
Closed on
Oct 8, 1998
Sold by
Michael Lau and Michael Roger L
Bought by
Lau Michael and Lau Carl
Current Estimated Value
Home Financials for this Owner
Home Financials are based on the most recent Mortgage that was taken out on this home.
Original Mortgage
$173,539
Outstanding Balance
$37,372
Interest Rate
6.71%
Mortgage Type
FHA
Estimated Equity
$919,771
Purchase Details
Closed on
Sep 25, 1998
Sold by
Michael Lau and Michael Carl
Bought by
Hanewinckel Peter Doyle and Hanewinckel Dana
Home Financials for this Owner
Home Financials are based on the most recent Mortgage that was taken out on this home.
Original Mortgage
$173,539
Outstanding Balance
$37,372
Interest Rate
6.71%
Mortgage Type
FHA
Estimated Equity
$919,771
Purchase Details
Closed on
Oct 5, 1994
Sold by
Lau Roger and Lau Maria
Bought by
Lau Michael and Lau Carl
Create a Home Valuation Report for This Property
The Home Valuation Report is an in-depth analysis detailing your home's value as well as a comparison with similar homes in the area
Home Values in the Area
Average Home Value in this Area
Purchase History
| Date | Buyer | Sale Price | Title Company |
|---|---|---|---|
| Lau Michael | -- | North American Title Co | |
| Hanewinckel Peter Doyle | $178,000 | North American Title Co | |
| Lau Michael | -- | -- |
Source: Public Records
Mortgage History
| Date | Status | Borrower | Loan Amount |
|---|---|---|---|
| Open | Hanewinckel Peter Doyle | $173,539 |
Source: Public Records
Tax History
| Year | Tax Paid | Tax Assessment Tax Assessment Total Assessment is a certain percentage of the fair market value that is determined by local assessors to be the total taxable value of land and additions on the property. | Land | Improvement |
|---|---|---|---|---|
| 2025 | $3,286 | $279,038 | $206,633 | $72,405 |
| 2024 | $3,286 | $273,567 | $202,581 | $70,986 |
| 2023 | $3,208 | $268,203 | $198,608 | $69,595 |
| 2022 | $3,166 | $262,945 | $194,714 | $68,231 |
| 2021 | $3,123 | $257,790 | $190,896 | $66,894 |
| 2020 | $3,109 | $255,147 | $188,938 | $66,209 |
| 2019 | $3,026 | $250,145 | $185,234 | $64,911 |
| 2018 | $2,984 | $245,241 | $181,602 | $63,639 |
| 2017 | $2,884 | $240,433 | $178,041 | $62,392 |
| 2016 | $2,858 | $235,719 | $174,550 | $61,169 |
| 2015 | $2,835 | $232,179 | $171,928 | $60,251 |
| 2014 | $2,689 | $227,631 | $168,560 | $59,071 |
Source: Public Records
Map
Nearby Homes
- 5353 Cumberland Dr
- 5482 Myra Ave
- 5068 Cumberland Dr
- 10411 Saint Alban St
- 5843 La Jolla Way Unit 28
- 5372 Harvard Way
- 9598 Naples Dr
- 10292 Ethel St
- 9011 Cerise Ln Unit 129
- 9948 Del Rio Way Unit 98
- 9001 Cerise Ln Unit 109
- 9001 Cerise Ln Unit 113
- 10441 Rexford Dr
- 6007 Clementine Ln Unit 21
- 5000 Clementine Ln
- 4790 Montefino Dr
- 4644 Portofino Cir
- 4449 Avenida Granada
- 4385 Larwin Ave
- 9332 Nancy St
- 10012 Saint John Cir
- 10001 Saint George Cir
- 10011 Saint George Cir
- 10022 Saint John Cir
- 10001 Saint John Cir
- 10021 Saint George Cir
- 9991 Madrid Cir
- 10011 Saint John Cir
- 9988 Madrid Cir
- 10021 Saint John Cir
- 9981 Madrid Cir
- 5331 Belle Ave
- 5351 Belle Ave
- 9982 Capri Cir
- 9984 Madrid Cir
- 9990 Capri Cir
- 5361 Belle Ave
- 10002 Saint George Cir
- 10002 Saint Michael Cir
- 5311 Belle Ave
Your Personal Tour Guide
Ask me questions while you tour the home.