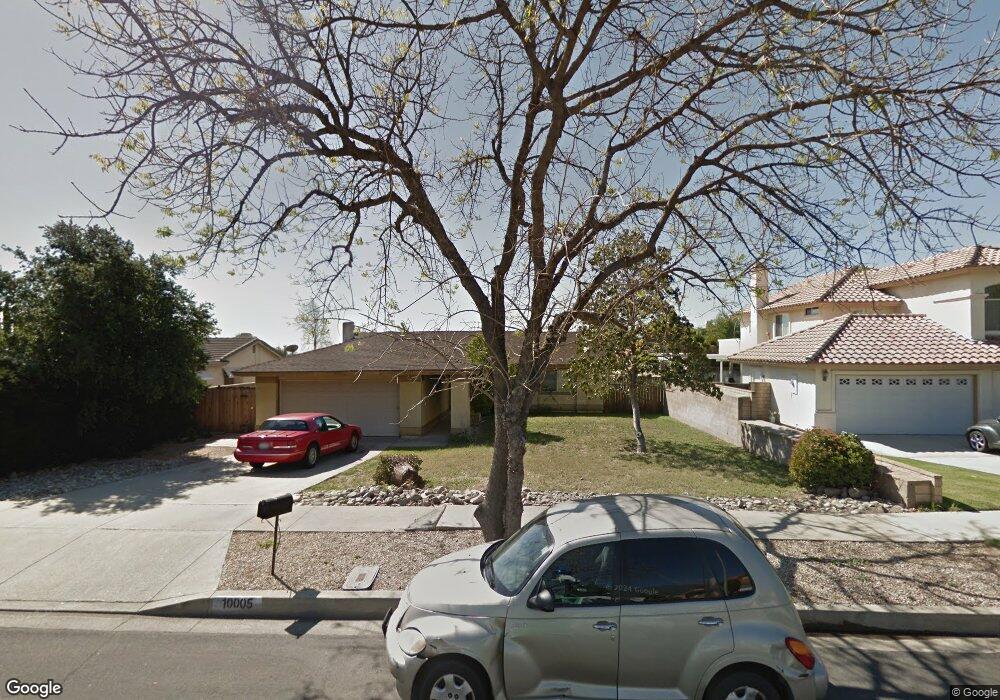
10005 Orange St Rancho Cucamonga, CA 91737
Estimated Value: $653,499 - $851,000
4
Beds
4
Baths
2,560
Sq Ft
$296/Sq Ft
Est. Value
About This Home
This home is located at 10005 Orange St, Rancho Cucamonga, CA 91737 and is currently estimated at $758,625, approximately $296 per square foot. 10005 Orange St is a home located in San Bernardino County with nearby schools including Deer Canyon Elementary, Vineyard Junior High, and Los Osos High.
Ownership History
Date
Name
Owned For
Owner Type
Purchase Details
Closed on
Nov 26, 2019
Sold by
Llobrera Cesar D and Llobrera Magdalena F
Bought by
C Llobrera Family Trust
Current Estimated Value
Purchase Details
Closed on
Jul 1, 2005
Sold by
Ma Phuong Tram Paticia
Bought by
Linsey Steven Leonard
Purchase Details
Closed on
Jun 22, 2005
Sold by
Linsey Steven Leonard
Bought by
Rialto Housing Authority
Purchase Details
Closed on
Apr 21, 2004
Sold by
Snavely George A
Bought by
Patino Oscar
Purchase Details
Closed on
Feb 14, 1999
Sold by
Richter Wolfgang K and Richter Maria L
Bought by
Richter Wolfgang Karl
Purchase Details
Closed on
Oct 17, 1995
Sold by
Dieffenbacher Mark S and Dieffenbacher Sandra D
Bought by
First Mtg Corp
Purchase Details
Closed on
Dec 28, 1993
Sold by
Nashed Yacoub and Nashed Ellen
Bought by
Abu Assal Maged L and Abu Assal Michelle Jene
Purchase Details
Closed on
Jun 17, 1993
Sold by
Bouschet John P
Bought by
Kim Wook Jin
Create a Home Valuation Report for This Property
The Home Valuation Report is an in-depth analysis detailing your home's value as well as a comparison with similar homes in the area
Home Values in the Area
Average Home Value in this Area
Purchase History
| Date | Buyer | Sale Price | Title Company |
|---|---|---|---|
| C Llobrera Family Trust | -- | -- | |
| Linsey Steven Leonard | -- | First American Lh | |
| Rialto Housing Authority | -- | First American Lh | |
| Patino Oscar | -- | -- | |
| Richter Wolfgang Karl | -- | -- | |
| First Mtg Corp | $63,721 | First American Title Ins Co | |
| Abu Assal Maged L | -- | First American Title Ins Co | |
| Kim Wook Jin | $55,000 | World Title Company |
Source: Public Records
Tax History Compared to Growth
Tax History
| Year | Tax Paid | Tax Assessment Tax Assessment Total Assessment is a certain percentage of the fair market value that is determined by local assessors to be the total taxable value of land and additions on the property. | Land | Improvement |
|---|---|---|---|---|
| 2025 | $1,521 | $136,770 | $22,645 | $114,125 |
| 2024 | $1,521 | $134,088 | $22,201 | $111,887 |
| 2023 | $1,487 | $131,459 | $21,766 | $109,693 |
| 2022 | $1,483 | $128,881 | $21,339 | $107,542 |
| 2021 | $1,483 | $126,354 | $20,921 | $105,433 |
| 2020 | $1,423 | $125,058 | $20,706 | $104,352 |
| 2019 | $1,439 | $122,606 | $20,300 | $102,306 |
| 2018 | $1,407 | $120,202 | $19,902 | $100,300 |
| 2017 | $1,345 | $117,845 | $19,512 | $98,333 |
| 2016 | $1,309 | $115,534 | $19,129 | $96,405 |
| 2015 | $1,301 | $113,799 | $18,842 | $94,957 |
| 2014 | $1,265 | $111,570 | $18,473 | $93,097 |
Source: Public Records
Map
Nearby Homes
- 6360 Daylily Ct
- 10655 401 Lemon Ave Unit 401
- 10141 Orange St
- 9855 Banyan St
- 6281 Kinlock Ave
- 10123 Finch Ave
- 9757 Balaton St
- 6600 Montresor Place
- 10330 Orange St
- 6644 Brissac Place
- 6155 Klusman Ave
- 10393 Cartilla Ct
- 6740 London Ave
- 9979 Timbermist Ct
- 5885 Zapata Place
- 9504 Lemon Ave
- 9740 Woodleaf Dr
- 10040 Jonquil Dr
- 6765 Jadeite Ave
- 6055 Amethyst Ave
- 10015 Orange St
- 9995 Orange St
- 10008 Bristol Dr
- 10018 Bristol Dr
- 9998 Bristol St
- 9985 Orange St
- 10025 Orange St
- 10006 Orange St
- 9988 Bristol St
- 10028 Bristol Dr
- 9996 Orange St
- 10016 Orange St
- 10035 Orange St
- 9986 Orange St
- 10026 Orange St
- 10038 Bristol Dr
- 10036 Orange St
- 10047 Orange St
- 6348 Phillips Way
- 10007 Bristol Dr