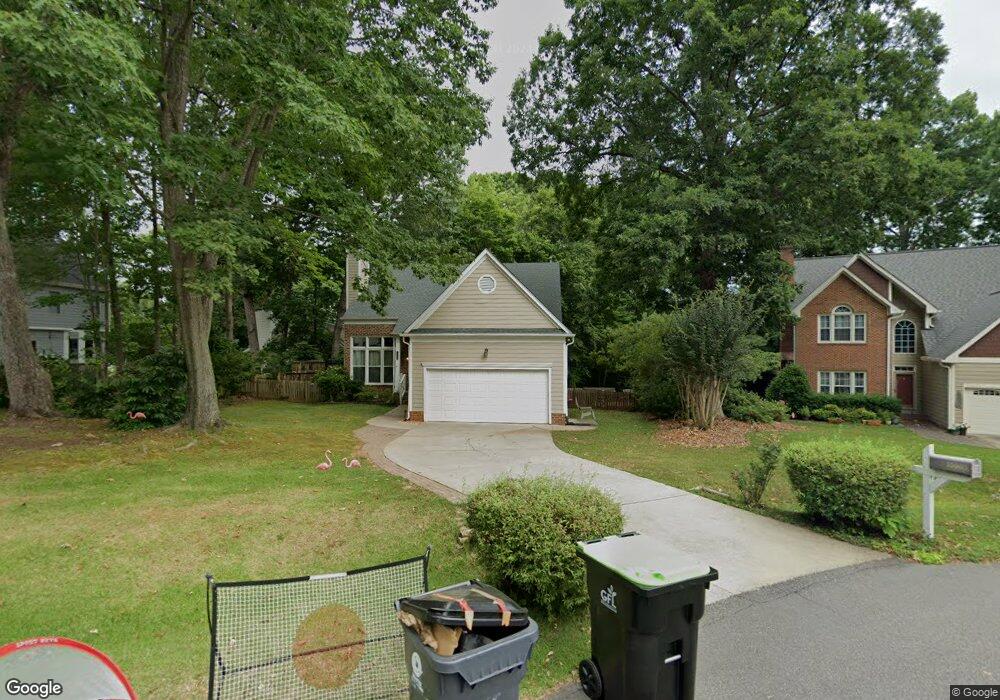
10005 Quillstone Ct Raleigh, NC 27613
Northwest Raleigh NeighborhoodEstimated Value: $472,843 - $572,000
4
Beds
3
Baths
1,898
Sq Ft
$283/Sq Ft
Est. Value
About This Home
This home is located at 10005 Quillstone Ct, Raleigh, NC 27613 and is currently estimated at $536,961, approximately $282 per square foot. 10005 Quillstone Ct is a home located in Wake County with nearby schools including Leesville Road Middle School, Leesville Road High School, and Quest Academy.
Ownership History
Date
Name
Owned For
Owner Type
Purchase Details
Closed on
Feb 5, 2019
Sold by
Robinson Stephen and Yu-Robinson Cynthia
Bought by
Velez Annie
Current Estimated Value
Home Financials for this Owner
Home Financials are based on the most recent Mortgage that was taken out on this home.
Original Mortgage
$259,200
Outstanding Balance
$227,883
Interest Rate
4.5%
Mortgage Type
New Conventional
Estimated Equity
$309,078
Purchase Details
Closed on
Sep 29, 2005
Sold by
Yu Robinson Cynthia and Robinson Stephen
Bought by
Yu Robinson Cynthia and Jen Cecilia
Home Financials for this Owner
Home Financials are based on the most recent Mortgage that was taken out on this home.
Original Mortgage
$176,000
Interest Rate
5.77%
Mortgage Type
Fannie Mae Freddie Mac
Purchase Details
Closed on
Jun 7, 2002
Sold by
Cormier Paul G and Cormier Jeannette C
Bought by
Zimpel David D and Zimpel Sheilah B
Home Financials for this Owner
Home Financials are based on the most recent Mortgage that was taken out on this home.
Original Mortgage
$156,000
Interest Rate
5.87%
Purchase Details
Closed on
Oct 24, 1997
Sold by
Mattocks Denise D and Keane Denise D
Bought by
Cormier Paul G and Cormier Jeannette C
Create a Home Valuation Report for This Property
The Home Valuation Report is an in-depth analysis detailing your home's value as well as a comparison with similar homes in the area
Home Values in the Area
Average Home Value in this Area
Purchase History
| Date | Buyer | Sale Price | Title Company |
|---|---|---|---|
| Velez Annie | $324,000 | None Available | |
| Yu Robinson Cynthia | -- | None Available | |
| Robinson Stephen | $220,000 | None Available | |
| Zimpel David D | $195,000 | -- | |
| Cormier Paul G | $152,500 | -- |
Source: Public Records
Mortgage History
| Date | Status | Borrower | Loan Amount |
|---|---|---|---|
| Open | Velez Annie | $259,200 | |
| Previous Owner | Robinson Stephen | $176,000 | |
| Previous Owner | Zimpel David D | $156,000 |
Source: Public Records
Tax History Compared to Growth
Tax History
| Year | Tax Paid | Tax Assessment Tax Assessment Total Assessment is a certain percentage of the fair market value that is determined by local assessors to be the total taxable value of land and additions on the property. | Land | Improvement |
|---|---|---|---|---|
| 2025 | $2,693 | $417,840 | $80,000 | $337,840 |
| 2024 | $2,615 | $417,840 | $80,000 | $337,840 |
| 2023 | $2,586 | $329,079 | $105,000 | $224,079 |
| 2022 | $2,397 | $329,079 | $105,000 | $224,079 |
| 2021 | $2,321 | $327,459 | $105,000 | $222,459 |
| 2020 | $2,283 | $327,459 | $105,000 | $222,459 |
| 2019 | $2,071 | $251,108 | $90,000 | $161,108 |
| 2018 | $1,904 | $251,108 | $90,000 | $161,108 |
| 2017 | $1,805 | $251,108 | $90,000 | $161,108 |
| 2016 | $1,769 | $251,108 | $90,000 | $161,108 |
| 2015 | $1,833 | $260,996 | $80,000 | $180,996 |
| 2014 | -- | $260,996 | $80,000 | $180,996 |
Source: Public Records
Map
Nearby Homes
- 5020 Celbridge Place
- 10109 Goodview Ct
- 8801 Wildwood Links
- 8701 Gleneagles Dr
- 8802 Fidelis Ln
- 5009 Wood Valley Dr
- 12909 Baybriar Dr
- 10729 Winding Wood Trail
- 5204 Barton View Ct
- 3812 Covina Dr
- 10305 Old Creedmoor Rd
- 8604 Wellsley Way
- 8326 Ray Rd
- 5428 Winding View Ln
- 10101 Lobley Hill Ln
- 9309 Field Maple Ct
- 1005 Berwyn Way
- 9305 Field Maple Ct
- 8605 Brookdale Dr
- 8701 Oneal Rd
- 10009 Quillstone Ct
- 10001 Quillstone Ct
- 5104 Celbridge Place
- 10013 Quillstone Ct
- 10004 Quillstone Ct
- 10000 Quillstone Ct
- 10012 Quillstone Ct
- 10008 Quillstone Ct
- 9908 Rimwood Ct
- 5122 Celbridge Place
- 5101 Celbridge Place
- 5112 Celbridge Place
- 10013 Kilnstone Ln
- 9904 Rimwood Ct
- 10009 Kilnstone Ln
- 9909 Rimwood Ct
- 10005 Kilnstone Ln
- 5116 Celbridge Place
- 10017 Kilnstone Ln
- 10001 Kilnstone Ln