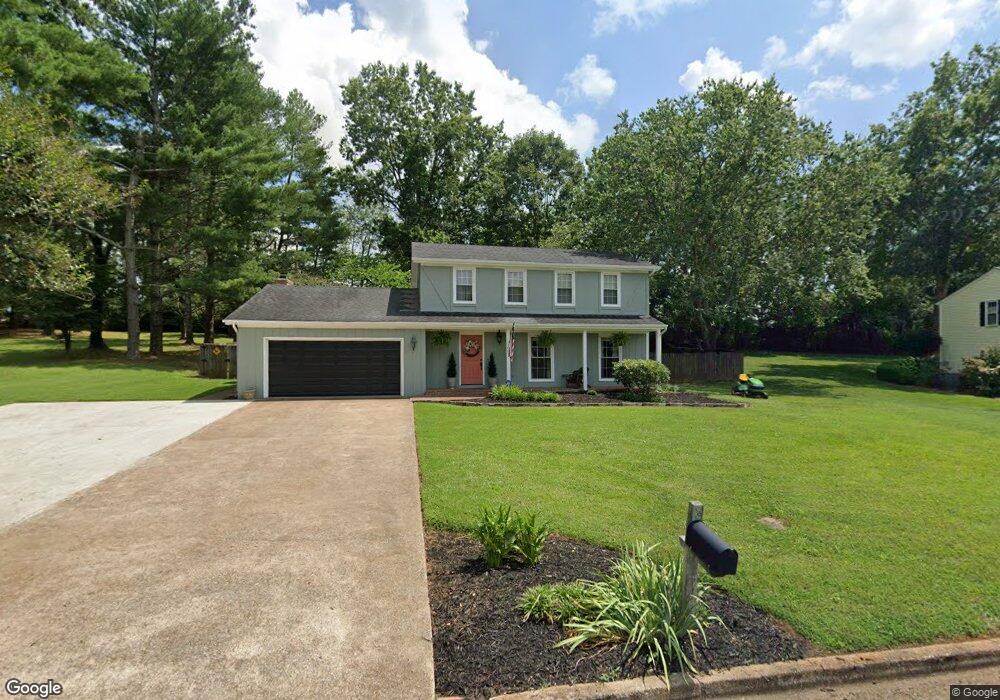
1001 2nd St Lawrenceburg, TN 38464
Estimated Value: $243,544 - $334,000
--
Bed
2
Baths
2,078
Sq Ft
$142/Sq Ft
Est. Value
About This Home
This home is located at 1001 2nd St, Lawrenceburg, TN 38464 and is currently estimated at $294,386, approximately $141 per square foot. 1001 2nd St is a home located in Lawrence County with nearby schools including Ingram Sowell Elementary School, Lawrenceburg Public Elementary School, and David Crockett Elementary School.
Ownership History
Date
Name
Owned For
Owner Type
Purchase Details
Closed on
Feb 28, 2007
Sold by
Roy Story
Bought by
Stutts Joseph B
Current Estimated Value
Home Financials for this Owner
Home Financials are based on the most recent Mortgage that was taken out on this home.
Original Mortgage
$141,000
Outstanding Balance
$85,108
Interest Rate
6.3%
Estimated Equity
$209,278
Purchase Details
Closed on
Dec 17, 2002
Sold by
Anita Story
Bought by
Roy Story
Home Financials for this Owner
Home Financials are based on the most recent Mortgage that was taken out on this home.
Original Mortgage
$120,000
Interest Rate
5.92%
Purchase Details
Closed on
Aug 29, 1990
Bought by
Story Roy and Story Anita
Purchase Details
Closed on
Jan 15, 1987
Bought by
Letherer Robert
Purchase Details
Closed on
Jan 1, 1980
Create a Home Valuation Report for This Property
The Home Valuation Report is an in-depth analysis detailing your home's value as well as a comparison with similar homes in the area
Home Values in the Area
Average Home Value in this Area
Purchase History
| Date | Buyer | Sale Price | Title Company |
|---|---|---|---|
| Stutts Joseph B | $150,000 | -- | |
| Roy Story | -- | -- | |
| Story Roy | $68,200 | -- | |
| Letherer Robert | -- | -- | |
| -- | $63,000 | -- |
Source: Public Records
Mortgage History
| Date | Status | Borrower | Loan Amount |
|---|---|---|---|
| Open | Not Available | $141,000 | |
| Previous Owner | Not Available | $120,000 |
Source: Public Records
Tax History Compared to Growth
Tax History
| Year | Tax Paid | Tax Assessment Tax Assessment Total Assessment is a certain percentage of the fair market value that is determined by local assessors to be the total taxable value of land and additions on the property. | Land | Improvement |
|---|---|---|---|---|
| 2025 | $1,514 | $48,700 | $0 | $0 |
| 2024 | $1,514 | $48,700 | $3,750 | $44,950 |
| 2023 | $1,514 | $48,700 | $3,750 | $44,950 |
| 2022 | $1,514 | $48,700 | $3,750 | $44,950 |
| 2021 | $1,358 | $30,900 | $3,000 | $27,900 |
| 2020 | $1,358 | $30,900 | $3,000 | $27,900 |
| 2019 | $1,358 | $30,900 | $3,000 | $27,900 |
| 2018 | $1,358 | $30,900 | $3,000 | $27,900 |
| 2017 | $1,358 | $30,900 | $3,000 | $27,900 |
| 2016 | $1,358 | $30,900 | $3,000 | $27,900 |
| 2015 | $1,286 | $30,900 | $3,000 | $27,900 |
| 2014 | $1,199 | $28,800 | $3,000 | $25,800 |
Source: Public Records
Map
Nearby Homes