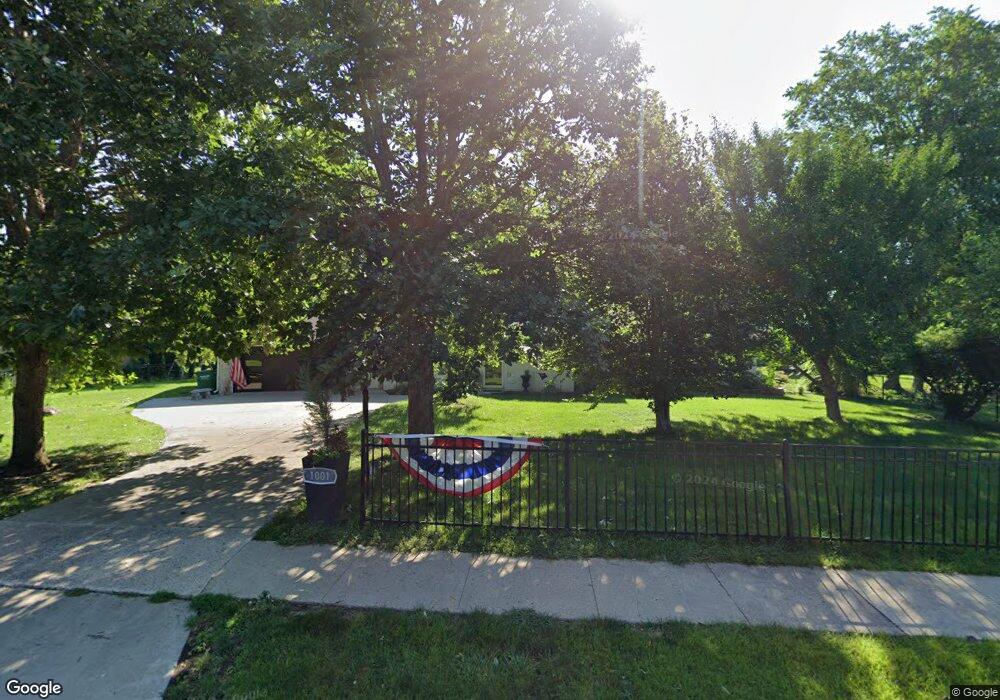
1001 7th St West Des Moines, IA 50265
Estimated Value: $328,000 - $376,000
2
Beds
2
Baths
2,403
Sq Ft
$146/Sq Ft
Est. Value
About This Home
This home is located at 1001 7th St, West Des Moines, IA 50265 and is currently estimated at $350,230, approximately $145 per square foot. 1001 7th St is a home located in Polk County with nearby schools including Hillside Elementary School, Stilwell Junior High School, and Valley Southwoods Freshman High School.
Ownership History
Date
Name
Owned For
Owner Type
Purchase Details
Closed on
Mar 18, 2025
Sold by
Plecas Reike T
Bought by
Reike T Plecas Revocable Trust and Plecas
Current Estimated Value
Purchase Details
Closed on
Feb 11, 2023
Sold by
St Paul Evangelical Lutheran Church Of D
Bought by
Rtpdib Investments Llc
Purchase Details
Closed on
Aug 15, 2016
Sold by
Plecas Barbara
Bought by
Plecas Reike and Plecas Samuel
Create a Home Valuation Report for This Property
The Home Valuation Report is an in-depth analysis detailing your home's value as well as a comparison with similar homes in the area
Home Values in the Area
Average Home Value in this Area
Purchase History
| Date | Buyer | Sale Price | Title Company |
|---|---|---|---|
| Reike T Plecas Revocable Trust | -- | None Listed On Document | |
| Reike T Plecas Revocable Trust | -- | None Listed On Document | |
| Rtpdib Investments Llc | -- | -- | |
| Plecas Reike | -- | None Available |
Source: Public Records
Tax History Compared to Growth
Tax History
| Year | Tax Paid | Tax Assessment Tax Assessment Total Assessment is a certain percentage of the fair market value that is determined by local assessors to be the total taxable value of land and additions on the property. | Land | Improvement |
|---|---|---|---|---|
| 2025 | $4,716 | $337,600 | $82,600 | $255,000 |
| 2024 | $4,716 | $308,000 | $74,400 | $233,600 |
| 2023 | $4,786 | $308,000 | $74,400 | $233,600 |
| 2022 | $4,728 | $256,700 | $64,500 | $192,200 |
| 2021 | $4,500 | $256,700 | $64,500 | $192,200 |
| 2020 | $4,428 | $233,000 | $58,400 | $174,600 |
| 2019 | $4,198 | $233,000 | $58,400 | $174,600 |
| 2018 | $4,202 | $213,400 | $52,000 | $161,400 |
| 2017 | $4,016 | $213,400 | $52,000 | $161,400 |
| 2016 | $3,924 | $198,500 | $47,800 | $150,700 |
| 2015 | $3,924 | $198,500 | $47,800 | $150,700 |
| 2014 | $3,784 | $195,500 | $46,200 | $149,300 |
Source: Public Records
Map
Nearby Homes
- 720 Valhigh Rd
- 829 7th St
- 2335 SE 5th St
- 686 63rd St
- 701 10th St
- 208 Prospect Ave
- 6513 Center St
- 6420 Center St
- 720 63rd St
- 6330 Center St
- 616 4th St
- 608 5th St Unit 2
- 924 13th St
- 704 12th St
- 1426 S Auburn Place
- Woodland Estates Pla
- 529 6th St Unit 2
- 800 13th St
- 525 6th St Unit 2
- 6750 School St Unit 206