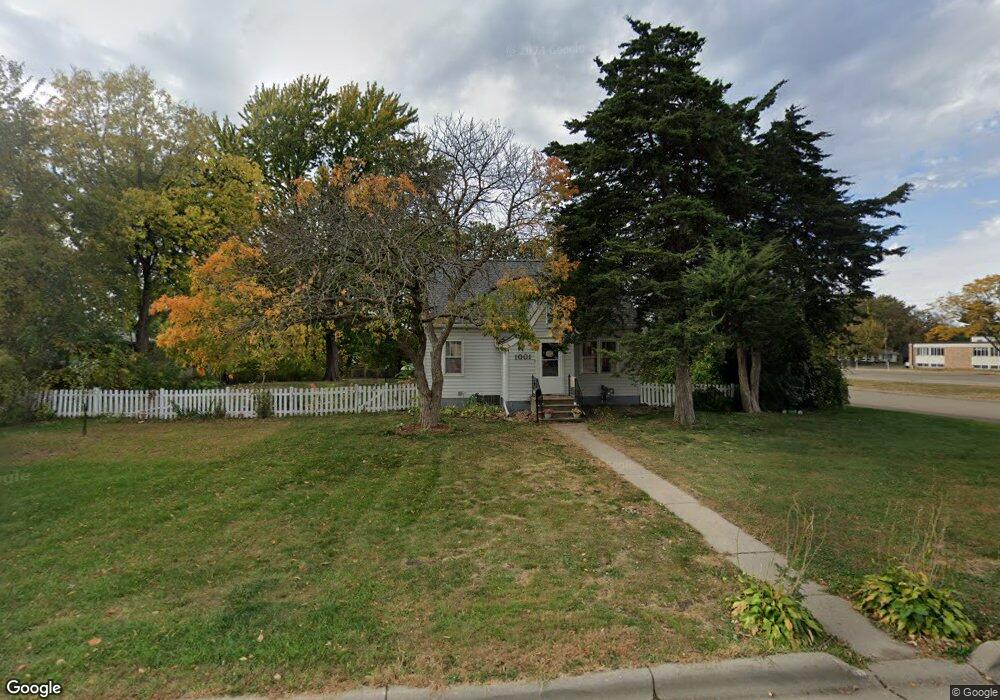
1001 Ashland Ave Saint Paul Park, MN 55071
Estimated Value: $279,000 - $290,588
3
Beds
1
Bath
1,097
Sq Ft
$262/Sq Ft
Est. Value
About This Home
This home is located at 1001 Ashland Ave, Saint Paul Park, MN 55071 and is currently estimated at $286,897, approximately $261 per square foot. 1001 Ashland Ave is a home located in Washington County with nearby schools including Pullman Elementary School, Oltman Middle School, and Park Senior High School.
Ownership History
Date
Name
Owned For
Owner Type
Purchase Details
Closed on
May 28, 2020
Sold by
Claussen Scott P and Claussen Julie
Bought by
Mazzitello Jasmine R
Current Estimated Value
Home Financials for this Owner
Home Financials are based on the most recent Mortgage that was taken out on this home.
Original Mortgage
$226,980
Outstanding Balance
$201,200
Interest Rate
3.2%
Mortgage Type
New Conventional
Estimated Equity
$85,697
Purchase Details
Closed on
Jul 13, 2018
Sold by
Metzler Brendan
Bought by
Clausesen Scott P
Home Financials for this Owner
Home Financials are based on the most recent Mortgage that was taken out on this home.
Original Mortgage
$185,185
Interest Rate
4.25%
Mortgage Type
FHA
Purchase Details
Closed on
Sep 14, 2012
Sold by
Wells Fargo Bank Na
Bought by
Federal Home Loan Mortgage Corporation
Purchase Details
Closed on
Mar 13, 2012
Sold by
Stadt Tammie A and Curzon Christopher A
Bought by
Wells Fargo Bank Na
Create a Home Valuation Report for This Property
The Home Valuation Report is an in-depth analysis detailing your home's value as well as a comparison with similar homes in the area
Home Values in the Area
Average Home Value in this Area
Purchase History
| Date | Buyer | Sale Price | Title Company |
|---|---|---|---|
| Mazzitello Jasmine R | $234,000 | Titlesmart Inc | |
| Clausesen Scott P | $190,000 | Titlesmart Inc | |
| Federal Home Loan Mortgage Corporation | -- | None Available | |
| Wells Fargo Bank Na | $144,521 | None Available |
Source: Public Records
Mortgage History
| Date | Status | Borrower | Loan Amount |
|---|---|---|---|
| Open | Mazzitello Jasmine R | $226,980 | |
| Previous Owner | Clausesen Scott P | $185,185 |
Source: Public Records
Tax History Compared to Growth
Tax History
| Year | Tax Paid | Tax Assessment Tax Assessment Total Assessment is a certain percentage of the fair market value that is determined by local assessors to be the total taxable value of land and additions on the property. | Land | Improvement |
|---|---|---|---|---|
| 2024 | $3,370 | $251,600 | $80,000 | $171,600 |
| 2023 | $3,370 | $234,700 | $75,100 | $159,600 |
| 2022 | $2,680 | $226,700 | $75,100 | $151,600 |
| 2021 | $2,414 | $188,700 | $62,500 | $126,200 |
| 2020 | $2,240 | $188,000 | $72,500 | $115,500 |
| 2019 | $2,158 | $173,900 | $61,000 | $112,900 |
| 2018 | $2,396 | $142,200 | $50,000 | $92,200 |
| 2017 | $2,396 | $139,200 | $50,000 | $89,200 |
| 2016 | $2,330 | $141,300 | $55,000 | $86,300 |
| 2015 | $2,256 | $137,700 | $55,000 | $82,700 |
| 2013 | -- | $116,900 | $45,400 | $71,500 |
Source: Public Records
Map
Nearby Homes
- 1033 Portland Ave
- 816 Holley Ave
- 1313 11th Ave
- 1200 Laurel Ave
- 1200 Summit Ave
- 801 Summit Ave
- 730 Pleasant Ave
- 1121 5th St
- 1227 5th St
- 1601 14th Ave
- 928 1st St
- 11XX 1st St
- 1142 1st St
- TBD Broadway Ave
- 1020 Gary Dr
- 6467 82nd St S
- 6444 Genevieve Trail
- 6745 Wildflower Dr S
- 6564 Genevieve Trail
- 10503 Glenbrook Ave S
- 1001 1001 Ashland-Avenue-
- 1009 Ashland Ave
- 1013 Ashland Ave
- 1000 Holley Ave
- 1017 Ashland Ave
- XXX Holley Ave
- 1000 Ashland Ave
- 1021 Ashland Ave
- 1002 Ashland Ave
- 1004 Ashland Ave
- 1000 1000 Holley Ave
- 1025 Ashland Ave
- 1025 1025 Ashland-Avenue-
- xxxx Holley Ave
- 1024 Ashland Ave
- 1037 Ashland Ave
- 1026 Holley Ave
- 1028 Ashland Ave
- 1041 Ashland Ave
- 1001 Laurel Ave