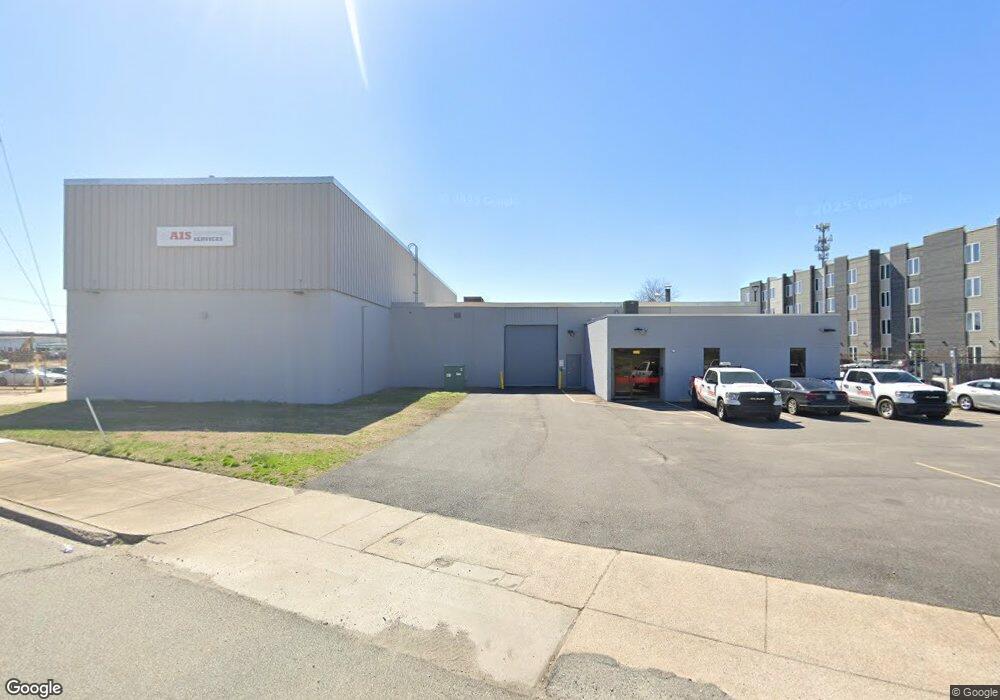
1001 E 4th St Richmond, VA 23224
Manchester NeighborhoodEstimated Value: $973,809
Studio
--
Bath
17,676
Sq Ft
$55/Sq Ft
Est. Value
About This Home
This home is located at 1001 E 4th St, Richmond, VA 23224 and is currently estimated at $973,809, approximately $55 per square foot. 1001 E 4th St is a home located in Richmond City with nearby schools including Blackwell Elementary School, Open High School, and Armstrong High School.
Ownership History
Date
Name
Owned For
Owner Type
Purchase Details
Closed on
Jun 28, 2019
Sold by
Hulsey Brandi B and Vincent Tammy
Bought by
Atlas Capital Transformation Llc
Current Estimated Value
Home Financials for this Owner
Home Financials are based on the most recent Mortgage that was taken out on this home.
Original Mortgage
$416,000
Outstanding Balance
$365,791
Interest Rate
4%
Mortgage Type
Commercial
Estimated Equity
$608,018
Create a Home Valuation Report for This Property
The Home Valuation Report is an in-depth analysis detailing your home's value as well as a comparison with similar homes in the area
Home Values in the Area
Average Home Value in this Area
Purchase History
| Date | Buyer | Sale Price | Title Company |
|---|---|---|---|
| Atlas Capital Transformation Llc | $521,000 | Attorney |
Source: Public Records
Mortgage History
| Date | Status | Borrower | Loan Amount |
|---|---|---|---|
| Open | Atlas Capital Transformation Llc | $416,000 |
Source: Public Records
Tax History
| Year | Tax Paid | Tax Assessment Tax Assessment Total Assessment is a certain percentage of the fair market value that is determined by local assessors to be the total taxable value of land and additions on the property. | Land | Improvement |
|---|---|---|---|---|
| 2025 | $9,924 | $827,000 | $455,000 | $372,000 |
| 2024 | $8,772 | $731,000 | $358,000 | $373,000 |
| 2023 | $7,992 | $666,000 | $293,000 | $373,000 |
| 2022 | $6,768 | $564,000 | $209,000 | $355,000 |
| 2020 | $6,372 | $531,000 | $186,000 | $345,000 |
| 2019 | $6,252 | $521,000 | $181,000 | $340,000 |
| 2018 | $5,544 | $462,000 | $135,000 | $327,000 |
| 2017 | $5,544 | $462,000 | $135,000 | $327,000 |
| 2016 | $5,544 | $462,000 | $135,000 | $327,000 |
| 2015 | $5,544 | $462,000 | $139,000 | $323,000 |
| 2014 | $5,544 | $462,000 | $139,000 | $323,000 |
Source: Public Records
Map
Nearby Homes
- 121 E 6th St
- 119 E 6th St
- 117 E 6th St
- 115 E 6th St
- 113 E 6th St
- 606 Decatur St
- 608 Decatur St
- 1600 Edwards Ave
- 201 Hull St Unit 44
- 1027 Decatur St
- 124 Lipscomb St
- 1400 Decatur St
- 901 Bainbridge St
- 903 Bainbridge St
- 1701 Maury St
- 104 E 15th St
- 1703 Maury St
- 1800 Ingram Ave
- 1813 Fairfax Ave
- 4820 Old Main St Unit 311
Your Personal Tour Guide
Ask me questions while you tour the home.