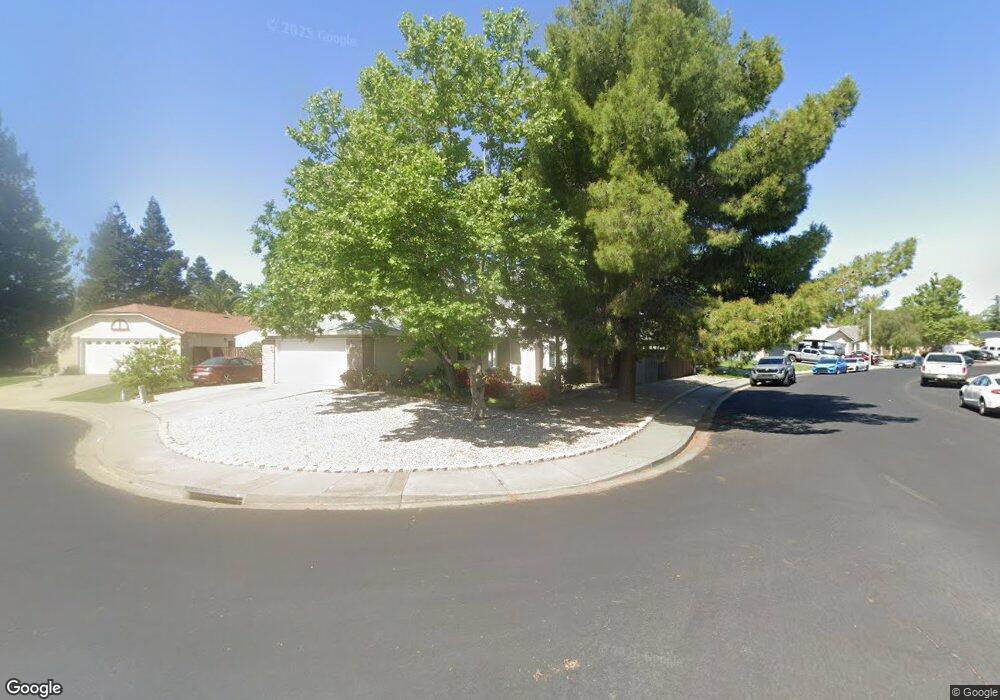
1001 Flint Ct Vacaville, CA 95687
Estimated Value: $558,975 - $603,000
4
Beds
2
Baths
1,290
Sq Ft
$445/Sq Ft
Est. Value
About This Home
This home is located at 1001 Flint Ct, Vacaville, CA 95687 and is currently estimated at $573,744, approximately $444 per square foot. 1001 Flint Ct is a home located in Solano County with nearby schools including Foxboro Elementary School, Golden West Middle School, and Vanden High School.
Ownership History
Date
Name
Owned For
Owner Type
Purchase Details
Closed on
Dec 13, 2016
Sold by
Spannaus Crispina E
Bought by
Spannaus Crispina E and The Crispina E Spannaus Revoca
Current Estimated Value
Purchase Details
Closed on
Aug 1, 2001
Sold by
Spannaus Michael A and Spannaus Crispina
Bought by
Spannaus Michael A and Spannaus Crispina E
Home Financials for this Owner
Home Financials are based on the most recent Mortgage that was taken out on this home.
Original Mortgage
$192,000
Outstanding Balance
$74,625
Interest Rate
7.1%
Estimated Equity
$499,119
Purchase Details
Closed on
Jan 12, 1996
Sold by
Lewis Homes Of California
Bought by
Spannaus Michael A and Spannaus Crispina
Home Financials for this Owner
Home Financials are based on the most recent Mortgage that was taken out on this home.
Original Mortgage
$159,889
Interest Rate
7.18%
Mortgage Type
Assumption
Create a Home Valuation Report for This Property
The Home Valuation Report is an in-depth analysis detailing your home's value as well as a comparison with similar homes in the area
Home Values in the Area
Average Home Value in this Area
Purchase History
| Date | Buyer | Sale Price | Title Company |
|---|---|---|---|
| Spannaus Crispina E | -- | None Available | |
| Spannaus Michael A | -- | Fidelity National Title Co | |
| Spannaus Michael A | $160,000 | First American Title Guarant |
Source: Public Records
Mortgage History
| Date | Status | Borrower | Loan Amount |
|---|---|---|---|
| Open | Spannaus Michael A | $192,000 | |
| Closed | Spannaus Michael A | $159,889 |
Source: Public Records
Tax History Compared to Growth
Tax History
| Year | Tax Paid | Tax Assessment Tax Assessment Total Assessment is a certain percentage of the fair market value that is determined by local assessors to be the total taxable value of land and additions on the property. | Land | Improvement |
|---|---|---|---|---|
| 2025 | $9,067 | $274,477 | $83,062 | $191,415 |
| 2024 | $9,067 | $269,096 | $81,434 | $187,662 |
| 2023 | $8,964 | $263,821 | $79,838 | $183,983 |
| 2022 | $8,880 | $258,649 | $78,273 | $180,376 |
| 2021 | $8,874 | $253,579 | $76,739 | $176,840 |
| 2020 | $8,799 | $250,980 | $75,953 | $175,027 |
| 2019 | $8,726 | $246,060 | $74,464 | $171,596 |
| 2018 | $8,667 | $241,236 | $73,004 | $168,232 |
| 2017 | $8,542 | $236,507 | $71,573 | $164,934 |
| 2016 | $8,493 | $231,870 | $70,170 | $161,700 |
| 2015 | $3,113 | $228,388 | $69,116 | $159,272 |
| 2014 | $3,065 | $223,916 | $67,763 | $156,153 |
Source: Public Records
Map
Nearby Homes
- 845 Turquoise St
- 355 Zachary Dr
- 917 Turquoise St
- 790 Morissette Way
- 921 Topaz Cir
- 925 Cloverbrook Cir
- 115 American Way
- 773 Peregrine Way
- 231 Park Ln
- 918 Moonstone Ct
- 309 Nancy Ln
- 224 Park Ln
- 196 Caldwell Dr
- 3510 Nut Tree Rd
- 805 Broadfork Cir
- 644 Canterbury Cir
- 137 Marna Dr
- 165 Audrey Place
- 2031 Newcastle Dr
- 4054 Camden Ct
- 1007 Flint Ct
- 843 Flint Way
- 848 Flint Way
- 842 Flint Way
- 849 Flint Way
- 1037 Cinnabar Way
- 1031 Cinnabar Way
- 1031 Flint Ct
- 854 Flint Way
- 1043 Cinnabar Way
- 836 Flint Way
- 855 Flint Way
- 1019 Flint Ct
- 1025 Cinnabar Way
- 1049 Cinnabar Way
- 1025 Flint Ct
- 1019 Cinnabar Way
- 1042 Galena Ct
- 860 Flint Way
- 1055 Cinnabar Way