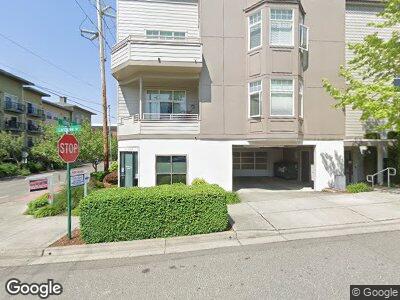
1001 Larrabee Ave Unit 204 Bellingham, WA 98225
Fairhaven NeighborhoodEstimated Value: $387,546 - $508,000
--
Bed
--
Bath
618
Sq Ft
$726/Sq Ft
Est. Value
About This Home
This home is located at 1001 Larrabee Ave Unit 204, Bellingham, WA 98225 and is currently estimated at $448,387, approximately $725 per square foot. 1001 Larrabee Ave Unit 204 is a home located in Whatcom County with nearby schools including Lowell Elementary School, Fairhaven Middle School, and Sehome High School.
Ownership History
Date
Name
Owned For
Owner Type
Purchase Details
Closed on
Jul 18, 2003
Sold by
Count Your Fries Llc
Bought by
Mcwilliams John E and Mcwilliams Marcia S
Current Estimated Value
Create a Home Valuation Report for This Property
The Home Valuation Report is an in-depth analysis detailing your home's value as well as a comparison with similar homes in the area
Home Values in the Area
Average Home Value in this Area
Purchase History
| Date | Buyer | Sale Price | Title Company |
|---|---|---|---|
| Mcwilliams John E | -- | Chicago Title Insurance |
Source: Public Records
Tax History Compared to Growth
Tax History
| Year | Tax Paid | Tax Assessment Tax Assessment Total Assessment is a certain percentage of the fair market value that is determined by local assessors to be the total taxable value of land and additions on the property. | Land | Improvement |
|---|---|---|---|---|
| 2024 | $2,730 | $350,513 | $67,732 | $282,781 |
| 2023 | $2,730 | $350,513 | $67,732 | $282,781 |
| 2022 | $2,411 | $304,787 | $58,896 | $245,891 |
| 2021 | $2,271 | $258,295 | $49,912 | $208,383 |
| 2020 | $2,166 | $224,595 | $43,400 | $181,195 |
| 2019 | $1,467 | $207,000 | $40,000 | $167,000 |
| 2018 | $1,541 | $140,574 | $15,602 | $124,972 |
| 2017 | $1,406 | $126,740 | $14,064 | $112,676 |
| 2016 | $1,300 | $120,744 | $13,704 | $107,040 |
| 2015 | $1,224 | $116,306 | $13,164 | $103,142 |
| 2014 | -- | $105,936 | $12,000 | $93,936 |
| 2013 | -- | $105,936 | $12,000 | $93,936 |
Source: Public Records
Map
Nearby Homes
- 1101 Mckenzie Ave Unit 206
- 910 Harris Ave Unit 304
- 910 Harris Ave Unit 407
- 1301 8th St
- 1212 Old Fairhaven Pkwy Unit D202
- 707 Donovan Ave
- 1216 Old Fairhaven Pkwy Unit C203
- 1310 Old Fairhaven Pkwy Unit A-102
- 1315 Mill Ave
- 500 Wilson Ave
- 1014 11th St Unit 302
- 1605 Donovan Ave
- 912 11th St Unit 101
- 1005 15th St
- 1100 Taylor Ave
- 331 Chuckanut Dr N
- 805 11th St
- 4 Shorewood Dr
- 714 13th St
- 700 11th St Unit C-1
- 1001 Larrabee Ave
- 1001 Larrabee Ave Unit 101
- 1001 Larrabee Ave Unit 305
- 1001 Larrabee Ave Unit 206
- 1001 Larrabee Ave Unit 306
- 1001 Larrabee Ave Unit 304
- 1001 Larrabee Ave Unit 303
- 1001 Larrabee Ave Unit 301
- 1001 Larrabee Ave Unit 205
- 1001 Larrabee Ave Unit 204
- 1001 Larrabee Ave Unit 203
- 1001 Larrabee Ave Unit 201
- 1007 Larrabee Ave
- 1009 Larrabee Ave
- 1000 Mckenzie Ave
- 1410 11th St
- 1410 11th St
- 1002 Larrabee Ave
- 1006 Larrabee Ave
- 1440 10th St